
- Title
-
Circadian rhythmicity and light sensitivity of the zebrafish brain
- Authors
- Moore, H.A., and Whitmore, D.
- Source
- Full text @ PLoS One
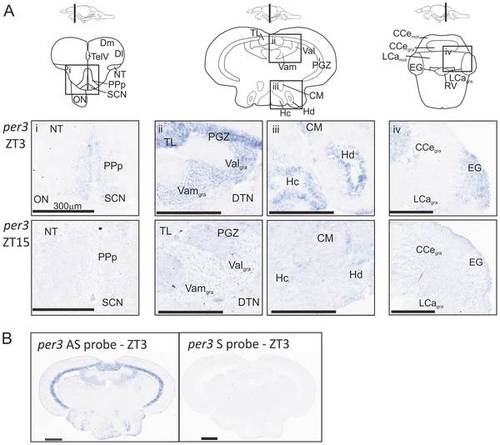
Regional per3 expression in the adult zebrafish brain. Adult zebrafish were kept on a 14:10LD cycle and brains were collected at ZT3 and ZT15. In situ hybridization was performed to show expression of per3 mRNA. A) Schematics of the brain containing the diencephalon, mesencephalon and rhombencephalon are shown. At ZT3 there is expression of per3 in the i) PPp and SCN, ii) PGZ, TL, Valgra and Vamgra, iii) CM, Hc and Hd, iv) EG, CCegra, and LCagra. At ZT15 there is either low or undetectable levels of per3 in these same regions. B) The antisense (AS) probe shows the per3 expression and the sense (S) control shows the background signal. |
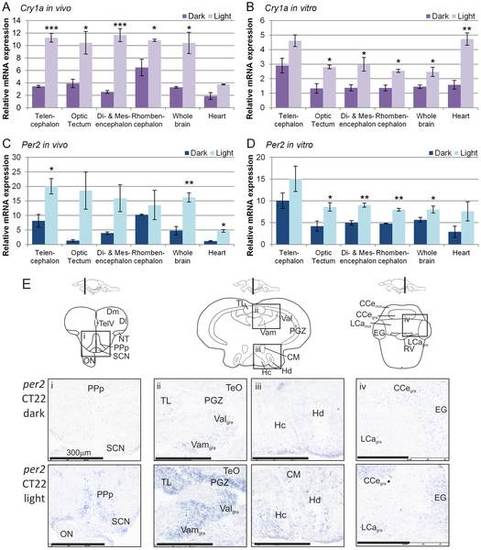
Expression of light sensitive genes, cry1a and per2, in the adult zebrafish brain. A & C) Wild type adult zebrafish were kept in the dark for 3 days and then either exposed to light for 3 hours or remained in the dark. The zebrafish were killed at CT22 and their brain and hearts dissected, RNA extracted and qPCR performed. The majority of samples collected from different brain regions showed the light responsive genes, cry1a and per2, were increased in light pulsed tissues compared to dark control. Numerous brain parts showed an increase in cry1a and per2 in the light pulsed samples (p<0.0001 and p = 0.0015 respectively, Two way ANOVA, n = 3). The light pulsed zebrafish had significantly higher cry1a and per2 levels in both the heart and brain (p<0.002, Two way ANOVA, n = 3). B & D) Wild type adult zebrafish brain parts, whole brains and hearts were cultured in L15-media for four days. Samples were exposed to a 3 hour light pulse or kept in the dark and collected at CT22, RNA extracted, and qPCR performed. Cry1a and per2 is induced by light in both the brain and heart (p<0.0001, Two way ANOVA, n = 3?5). The light pulsed brain part cultures had significantly higher cry1a and per2 levels than the dark controls (p<0.0001 and p = 0.0013 respectively, Two way ANOVA, n = 3). E) Wild type adult zebrafish were kept in the dark for 3 days and then either exposed to light for 3 hours or remained in the dark. The zebrafish were killed at CT22 and their brain dissected, fixed, frozen and sectioned. Chromogenic in situ hybridisation was performed to determine the location of per2 mRNA expression. There was minimal or undetectable expression in the dark samples. In the light pulsed samples expression of per2 was increased in the i) PPp and SCN, ii) PGZ, TL, Valgra and Vamgra, iii) Hc and Hd, iv) EG, CCegra, and LCagra. |
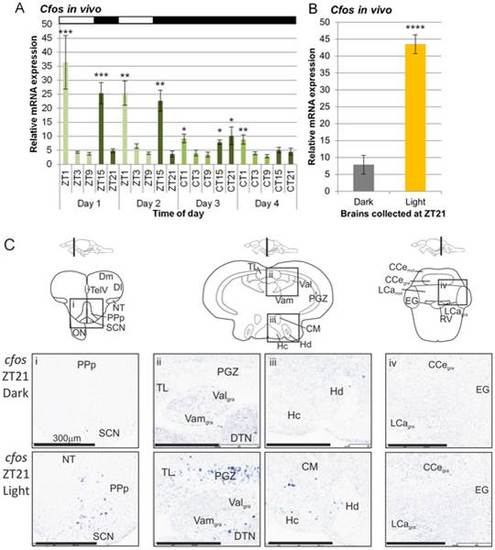
Expression of c-fos in the adult zebrafish brain. A) Zebrafish were kept on 2 days of 14:10 LD followed by 2 days of DD, and brains dissected at the times indicated. RNA was extracted and qPCR was performed to evaluate the relative expression of c-fos mRNA. In LD there was a peak at ZT1 and ZT15 on day 1 and 2, (p<0.0001, One way ANOVA, n = 4?9). The statistical significance is shown from the post-hoc Dunnett′s multiple comparison test, which used the calibrator Day 1 ZT9. In DD there was a peak at CT21 on day 3 and trough at CT9 on day 3 and day 4 (p<0.001, One way ANOVA, n = 4?9). The statistical significance is shown from the post-hoc Dunnett′s multiple comparison test, which used the calibrator CT9 on day 4. The above white and black bars indicate the lighting schedule, and the shades of green reflect the light, dark and subjective dark phases. B) Adult zebrafish on a 14:10LD were given a 30 minute light pulse or kept in the dark at ZT21. Brains were dissected, RNA extracted, and qPCR performed to determine levels of c-fos mRNA as an indicator of neuronal activity. C-fos expression was five-fold higher in the brains of the light pulsed zebrafish (p<0.0001, unpaired two-tailed t-test, n = 7?8). C) c-fos is induced in specific brain regions in response to a light pulse in the night. Adult zebrafish maintained on a 14L:10D LD cycle were exposed to a 30-min light pulse at ZT21 or kept in the dark. In situ hybridisation was performed on brain sections to determine the levels of c-fos mRNA. Regions that show increased c-fos expression in response to light include i) PPp and SCN, ii) TeO, TL, Valgra and Vamgra and iii) Hc and Hd. iv) There is no change in expression in the rhombencephalon. Abbreviations: PPp (dorsal pretectum), SCN (suprachiasmatic nuclei), TeO (optic tectum), TL (torus longitudinalis), Valgra (lateral valvula cerebelli), Vamgra (medial valvula cerebelli), Hc (caudal hypothalamus) and Hd (dorsal hypothalamus). |