
- Title
-
A nanobody-based system using fluorescent proteins as scaffolds for cell-specific gene manipulation
- Authors
- Tang, J.C., Szikra, T., Kozorovitskiy, Y., Teixiera, M., Sabatini, B.L., Roska, B., and Cepko, C.L.
- Source
- Full text @ Cell
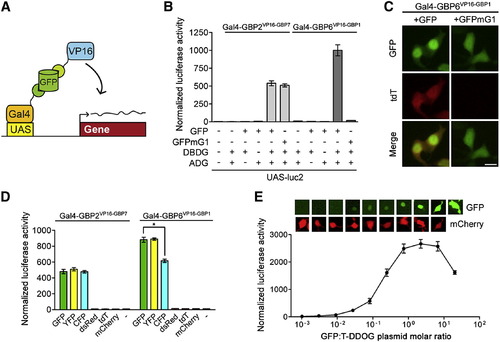
Characterization of the GFP-Dependent Transcription System (A) Schematic of Gal4-based T-DDOGs. (B) GFP-dependent activation of UAS-luc2 by Gal4-GBP6VP16-GBP1 and Gal4-GBP2VP16-GBP7. n = 9. (C) Gal4-GBP6VP16-GBP1 strongly activated UAS-tdT in the presence of GFP. Mutation of GBP1-binding residues in GFP (GFPmG1) abolished tdT activity. Scale bar, 10 μm. (D) Specificity of T-DDOGs for different fluorescent proteins. n = 9; p < 0.001. (E) Activity of Gal4-GBP6VP16-GBP1 in response to a varying amount of transfected GFP plasmids. The transfected DNA amount was kept constant among conditions, with CAG-mCherry (bottom) acting as a filler plasmid to compensate for reduction in GFP (top) plasmids. Panels show representative GFP and mCherry fluorescence in single cells for each corresponding data point below. n = 6. Plots are mean ± SD. See also Figures S1 and S2 and Table S2. |
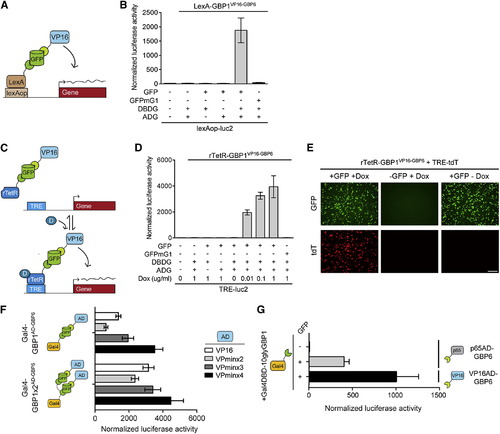
T-DDOGs Are Highly Adjustable (A–E) T-DDOGs based on LexA (A) and rTetR (C) DBDs. Doxycycline is “D” in (C). TRE includes seven tetO sequences (C). (B) LexA-GBP1VP16-GBP6 activated a lexAop-luc2 reporter only in the presence of GFP. n = 9. (D) rTetR-GBP1VP16-GBP6 activated TRE-luc2 in a GFP- and doxycycline-dependent manner. n = 6–9. (E) Similar results were seen with TRE-tdT. Doxycycline was used at 1 μg/ml. Images were taken 16 hr posttransfection. (F and G) Tuning T-DDOGs with adjustable DBDs and ADs. (F) Increasing the number of GBP1 on Gal4DBD (n = 6–9) enhanced the transcriptional potency for each ADG (n = 9). (G) Potency of p65AD compared to VP16AD. T-DDOGs used are Gal4-GBP1p65-GBP6 and Gal4-GBP1-BVP16-GBP6. n = 9. Scale bar, 100 μm. Plots are mean ± SD. |
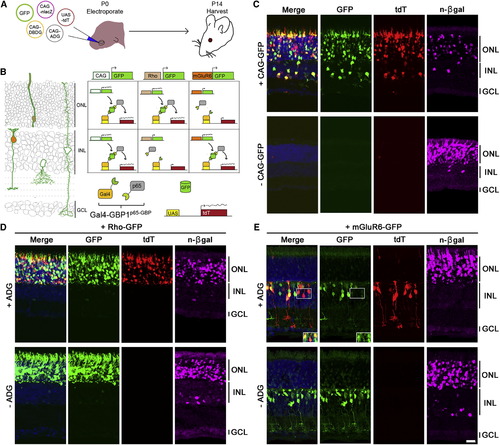
GFP Controls the Spatial Expression of Genes In Vivo (A) Schematic of experiment. (B and C) (B) (Left) In electroporated retinas, CAG-GFP expresses in multiple cell types (green outline). Rho-GFP expresses in photoreceptors of the ONL (beige fill). mGluR6-GFP expresses in ON bipolar cells of the INL (orange fill). GCL, ganglion cell layer. (Right) Anticipated UAS-tdT expression pattern aligned to left diagram (C) Gal4-GBP1p65-GBP6 induces UAS-tdT only in the presence of GFP. n-βgal (magenta) is an electroporation marker. (D and E) (Top) Rho-GFP and mGluR6-GFP induce tdT expression in rods and ON bipolar cells, respectively. (Bottom) tdT activation depends on ADG. Inset of (E) shows GFP and tdT colocalization upon GFP intensity enhancement. Merge panels includes GFP, tdT, and DAPI channels. Scale bar, 20 μm. See also Figures S3, S4, and S5 and Tables S3, S4, S5, and S6. |
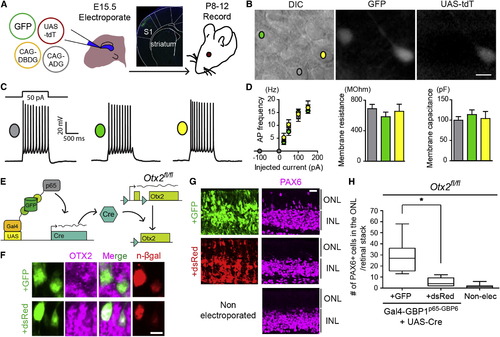
T-DDOGs Support Electrophysiological and Gene Perturbation Studies in the Central Nervous System (A) Electroporation setup for neuronal recordings. Micrograph shows GFP in electroporated primary somatosensory cortex (S1). (B–D) (B) Image of an acute brain slice from an electroporated mouse. Scale bar, 10 μm. Three categories of pyramidal layer 2/3 S1 neurons were recorded from brain slices: nonfluorescent controls (gray), GFP+ (green), and GFP+/tdT+ (yellow). (C) Representative single current-clamp trace of action potentials in response to a 50 pA, 1,000-ms-long step current injection. (D) Plots show action potential (AP) frequency upon current injection, as well as input resistance and membrane capacitance of recorded cell classes. p > 0.5 for all comparisons (n = 8–10 neurons per condition). Plots show mean ± SEM. (E–H) GFP-dependent excision of Otx2fl/fl in the retina. (E) P0, Otx2fl/fl mouse retina was electroporated with T-DDOG components and UAS-Cre and either CAG-GFP or CAG-dsRed. (F–H) (F) Loss of OTX2 was confirmed by OTX2 immunostaining and (G and H) ectopic PAX6+ ONL cells. n = 10 stacks, 5 retinas per electroporated condition. For nonelectroporated retina, n = 19 stacks, 10 retinas. Boxplots show median, maximum, and minimum values. Retinal stacks are 12-μm-thick confocal images. p < 0.001. n-βgal marks electroporated cells in (F). Scale bar, 5 μm in (F) and 20 μm in (G and H). See also Figures S6 and S7 and Table S7. |
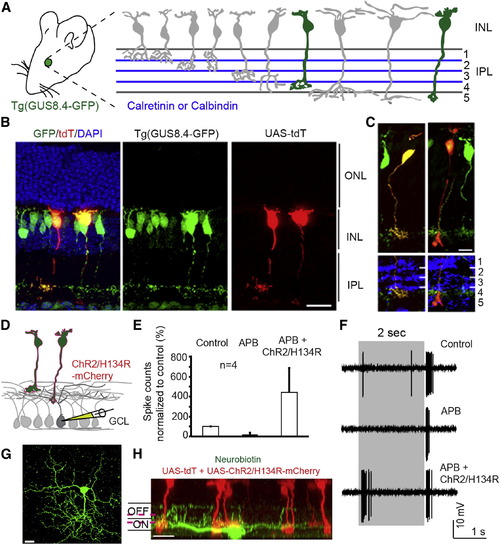
Retrofitting a Transgenic GFP Mouse Line for GFP-Dependent Manipulation of Gene Expression and Neural Circuit Activities (A) Tg(GUS8.4GFP) expresses GFP in type 7 cone bipolar and rod bipolar cell types (green fill) of the retina. Adopted schematic (Ghosh et al., 2004). (B) Cryosection of electroporated Tg(GUS8.4GFP) retina expressing Gal4-GBP2p65-GBP7 and UAS-tdT. Scale bar, 20 μm. (C) Type 7 (left) and rod bipolar (right) cell types labeled by UAS-tdT. Anti-Calretinin (left) or anti-Calbindin (right) staining identify specific layers of the IPL. Scale bar, 10 µm. GFP was immunostained in (B and C). (D) Schematic of ChR2 experiment. Electroporated Tg(GUS8.4-GFP) retinas expressing 10×UAS-ChR2/H134R-mCherry and 5×UAS-tdT were analyzed for ChR2-mediated responses in random GCL cells. (E) Cumulative plot of ON responses in GCL cells. Number of spikes counted during the first 300 ms after stimulus onset, normalized to control (minus APB). APB blocks ON responses originating from photoreceptors. Plots are mean ± SEM (n = 4 per condition). (F) Spiking response of a GCL cell. Gray bar, duration of light stimulus. Response to normal light stimuli under control condition (top) or in the presence of APB (middle). Light stimuli focused on INL activate ChR2/H134R in the presence of APB (lower). (G and H) Top and side views of a neurobiotin-filled (green) ganglion cell identified by light stimulation of ChR2. Magenta lines indicate level of anti-Chat bands (not shown). Scale bar, 20 μm. |
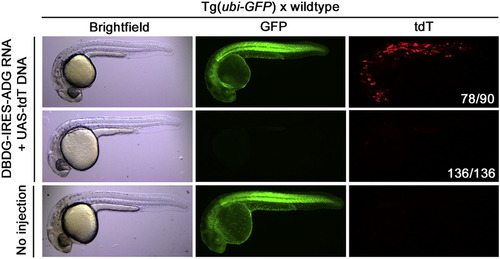
GFP-Dependent Transcription in Transgenic Zebrafish Embryos from Tg(ubi-GFP) × wild-type outcrosses were microinjected with DBDG-IRES-ADG (Gal4-GBP1p65-GBP6) RNA and UAS-tdT DNA at the one- to two-cell stage and examined 1 to 2 days postfertilization. Images represent X number of embryos out of Y number of injected embryos (X/Y), shown in white font in tdT panel. |
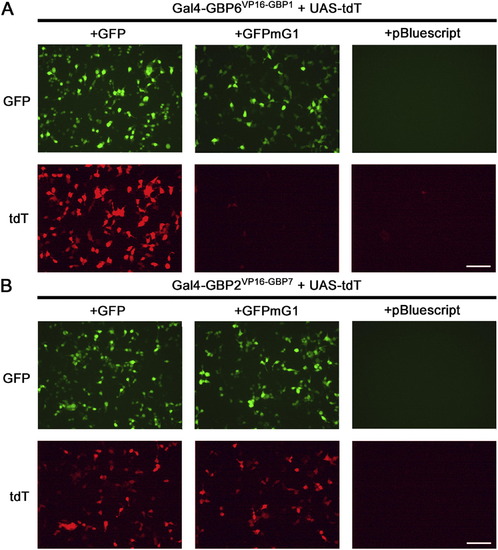
GFP-Dependent Activation of UAS-tdT In Vitro, Related to Figure 2 (A and B) Representative images of Gal4-GBP6VP16-GBP1 (A) and Gal4-GBP2VP16-GBP7 (B) activation of an UAS-tdT reporter in 293T cells. Cells were transfected with all indicated constructs and imaged 16 hr post-transfection. GFP, GFPmG1, DBDG and ADG constructs were delivered in separate plasmids under the CAG-promoter. Results are representative of 4 independent experiments and quantifications are tabulated in Table S2. Scale bar, 100 μm. |
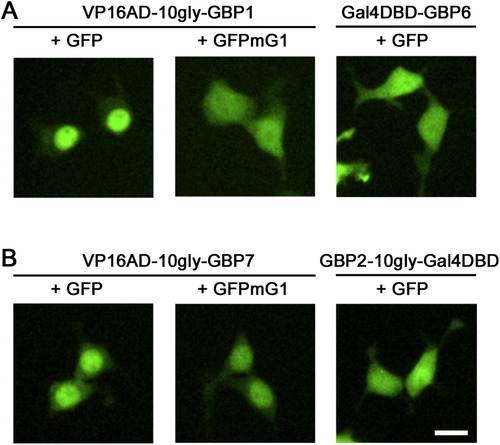
VP16AD-GBP Fusions Can Localize GFP to the Nucleus, Related to Figure 2 Representative images of GFP localization in 293T cells transfected with pCAG-GFP or pCAG-GFPmG1 along with CAG-driven DBDG or ADG plasmids at a 1:2 molar plasmid ratio. Fluorescent micrographs were taken at 16 hr post-transfection in live cells. Scale bar, 15μm. |
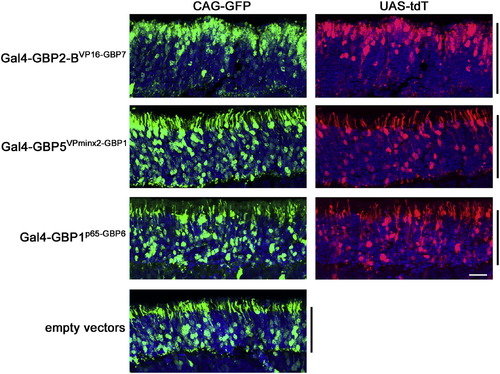
T-DDOGS Composed of VPminx2AD and p65AD Give Normal Positioning of Rod Photoreceptors in the Retina, Related to Figure 4 Representative images showing the effects of selected T-DDOGs on rod photoreceptor positioning. CD1 mouse retinas were electroporated at P0 in vivo with plasmids encoding CAG-GFP (green), Gal4-GBPXAD-GBPY components, UAS-tdT (red) and CAG-nlacZ. The electroporated GFP:DBDG:ADG plasmid mass ratio is 2:2:1. Retinas were harvested at P14. Confocal stacks of retina sections spanning the ONL (black bar) are shown. Each set of panels was adjusted individually to similar levels to reveal the cell bodies. DAPI is blue in all panels. Scale bar, 20 μm. Non-linear adjustment using the gamma function was applied to show weak GFP or tdT-expressing cells to minimize their signals from being obscured by those of stronger-expressing equivalents. The scleral portion of the ONL is the upper half of each image. |
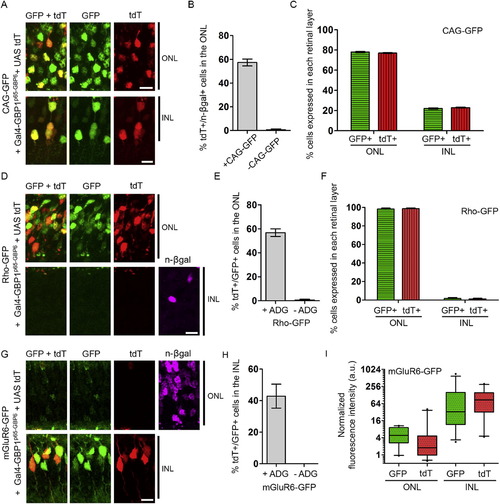
Quantification of Gal4-GBP1p65-GBP6 Activities in the Retina, Related to Figure 4 Refer to Figure 4 and Experimental Procedures for experimental setup. (A, D, and G) Colocalization of different promoter-driven GFP (green) with tdT (red) in retinas expressing Gal4-GBP1p65-GBP6. (B, E, and H) Efficiency and specificity of Gal4-GBP1p65-GBP6 in vivo. Removal of CAG-GFP (B) or ADG (E, H) abolished reporter expression. In (B), the ordinate shows the percentage of tdT-expressing cells among the electroporated cells in the ONL, as assessed by expression of the electroporation marker, n-βgal. n-βgal detection and/or expression were poor in the INL, preventing analysis of Gal4-GBP1p65-GBP6 efficiency in the INL from the sample in (B). (C and F) Distribution of GFP and tdT expressing cells in electroporated retinas. Weak, leaky mGluR6-GFP expression in the ONL made it difficult to perform this analysis by cell-counting. (I) Quantification of fluorescent intensity of cells expressing GFP and tdT in (G). Boxplots indicate median, interquartile range, and 5%–95% range. y axis is on log2 scale. n = 25 each condition. For (B), (C), (E), (F), (H), plots are mean and SD. Scale bar, 10 μm. Note the tdT+/GFP+ data points for Rho-GFP, +ADG (E) and mGluR6-GFP, +ADG (H) were also presented in Figure S5 for a different argument. |
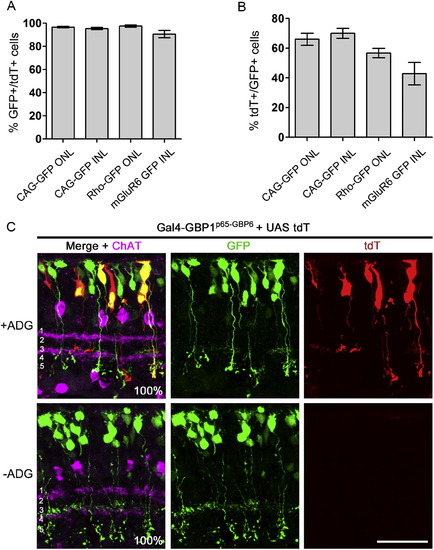
Additional Analysis of Electroporated Retinas from Figure S4, Related to Figure 4 Refer to Figure 4 and Methods for experimental setup. (A) Tight-coupling of tdT+ cells with GFP expression. Among cells that expressed tdT, the percentage of cells expressing GFP is shown. (B) Efficiency of tdT activation in GFP-expressing cells. Percentage of tdT+ cells among GFP+ cells. Note the tdT+/GFP+ data points for Rho-GFP and mGluR6-GFP were also presented in Figure S4 for a different argument. Plots show mean ± SD. See Table S3 for summary. (C) mGluR6-GFP bipolar cells project to the correct IPL sublaminae in the presence of Gal4-GBP1p65-GBP6. CD1 mouse retinas were electroporated at P0 with plasmids encoding mGluR6-GFP (green), Gal4-GBP1p65-GBP6, UAS-tdT (red) and CAG-nlacZ. Retinas stained for anti-GFP (green) and anti-ChAT (magenta). The IPL is divided into 5 sublaminae (white font in merge panels), with the ON bipolar cells stratifying below the midline dividing sublaminae 2 and 3. Anti-ChAT labels the boundary between sublaminae 1 and 2, and also the boundary between 3 and 4. % GFP+ and GFP+/tdT+ cells stratifying below the midline of 2 and 3 are shown in merge panels. n = 28 for +ADG condition and n = 31 for –ADG condition. Cells were sampled across two retinas per condition. Scale bar, 20 μm. |
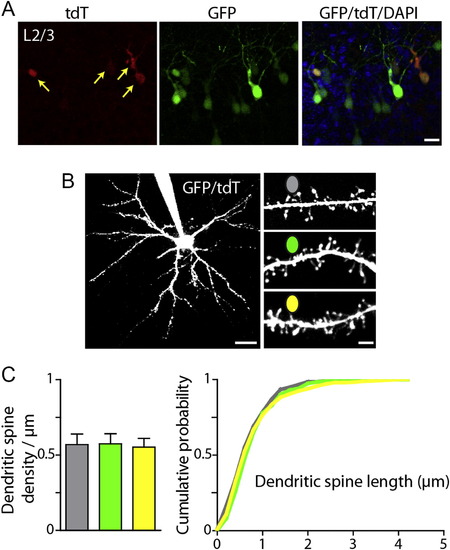
Structural Analysis of Electroporated Cortical Pyramidal Neurons, Related to Figure 5 Primary somatosensory cortex was electroporated at E15.5 with plasmids encoding GFP, ADG, DBDG, and UAS-tdT. T-DDOG is Gal4-GBP1p65-GBP6. (A) Confocal image of native GFP and tdT fluorescence in layers 2/3 of mouse primary somatosensory cortex. Red, tdT; green, GFP; overlay shows both channels with DAPI. A subset of GFP+ cells are tdT+, reflecting co-electroporation of 4 constructs. Arrows point to GFP+/tdT+ cells. Scale bar, 20 μm. (B) Left, 2-photon Z-stack through a GFP+/tdT+ layer 2/3 pyramidal neuron filled with Alexa-594 through a patch pipette. Right, dendrites from GFP-, GFP+/tdT- and GFP+/tdT+ neurons at P13. Scale bars, 30 and 3 μm. (C) Summary data of dendritic spine density (left) and length (right) for electroporated pyramidal neurons at P12-14. Dendritic spine density and length did not differ among GFP-, GFP+/tdT- and GFP+/tdT+ neurons. (Dendritic spine density, n = 7 neurons and 15-24 dendrites per condition; spine length, <300 dendritic spines per condition). No GFP-/tdT+ neurons were observed in acute slices during recording or 2-photon imaging (n = 7 mice). Column plots are mean ± SEM. |
Reprinted from Cell, 154(4), Tang, J.C., Szikra, T., Kozorovitskiy, Y., Teixiera, M., Sabatini, B.L., Roska, B., and Cepko, C.L., A nanobody-based system using fluorescent proteins as scaffolds for cell-specific gene manipulation, 928-939, Copyright (2013) with permission from Elsevier. Full text @ Cell