
- Title
-
Time-gated optical projection tomography allows visualization of adult zebrafish internal structures
- Authors
- Fieramonti, L., Bassi, A., Foglia, E.A., Pistocchi, A., D'Andrea, C., Valentini, G., Cubeddu, R., De Silvestri, S., Cerullo, G., and Cotelli, F.
- Source
- Full text @ PLoS One

Resolution and contrast improvement with TGOPT. (a) Photo of the adult 22 mm long zebrafish used for the measurements. The red box shows the region considered for analyses. (b) Parallel projection captured by OPT. (c) Parallel projection obtained with an early-TGOPT. The early gate rejects multiple scattered photons, improving resolution and contrast. The effect is evident for the vertebral column in the center of the images, which should be displayed as a black structure if only ballistic photons were present, because of its large attenuation properties. Scale bar for (b)-(c) is 300 μm. |
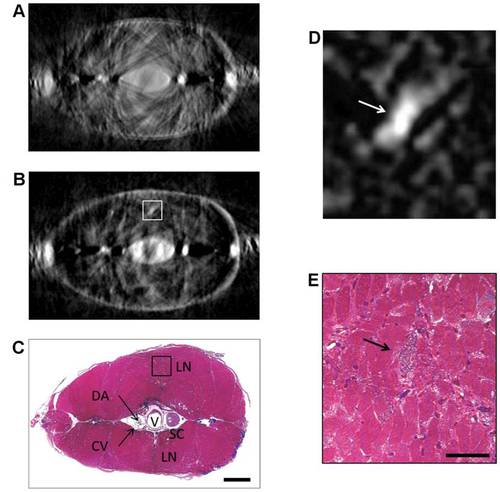
Comparison between transverse sections. (a) Virtual transverse section reconstructed by OPT. (b) Virtual transverse section reconstructed by early-TGOPT. (c) Correspondent histological section for comparison. V: vertebra, SC: spinal cord, LN: lateral nerve, DA: dorsal aorta, CV: cardinal vein. (d) Closeup of the highlighted area in the early-TGOPT section. (e) Closeup of the highlighted area in the histological section. The arrows point to the lateral nerve. Scale bar for (a)-(c) is 400 μm; scale bar for (d)-(e) is 50 μm. |

Orthogonal views of the TGOPT reconstructed volume. (a) Transverse, (b) sagittal, and (c) coronal sections. Scale bar is 400 μ. |
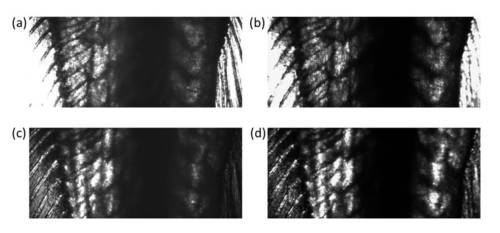
Parallel projections of the sample for the evaluation of the half-wave plate effect. (a) and (b) are respectively OPT and TGOPT projections of the specimen in the presence of the half-wave plate. (c) and (d) are projections obtained without the half-wave plate for OPT and TGOPT, respectively. |

Synchronization of the temporal window over the “signal” pulse. (a) Three representative positions of the gating window are depicted with respect to the indicative transmitted signal curve. (b) Parallel projection corresponding to gate T1. Only ballistic photons are captured, but the image has a very low contrast due to poor SNR. (c) Parallel projection corresponding to gate T2, delayed by 660 fs with respect to T1. Higher SNR is achieved, while multiply scattered photons are still rejected. (c) Parallel projection corresponding to gate T3, delayed by 1160 fs with respect to T1. Low SNR and strongly scattered photons spoil completely the image. Scale bar for (b)-(d) is. |