
- Title
-
Whole-Body Analysis of a Viral Infection: Vascular Endothelium is a Primary Target of Infectious Hematopoietic Necrosis Virus in Zebrafish Larvae
- Authors
- Ludwig, M., Palha, N., Torhy, C., Briolat, V., Colucci-Guyon, E., Brémont, M., Herbomel, P., Boudinot, P., and Levraud, J.P.
- Source
- Full text @ PLoS Pathog.
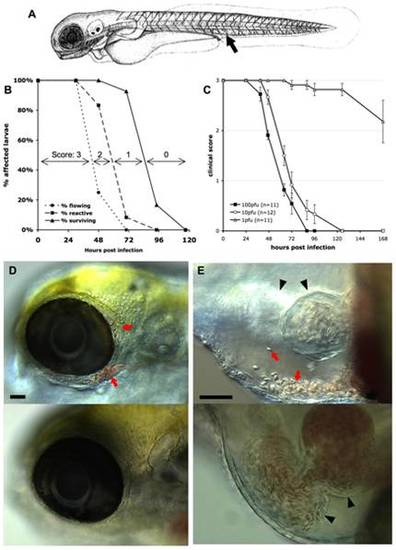
Macroscopic signs of IHNV infection. A. drawing of a 72 hpf larva (length, ~3 mm) showing the site of inoculation (arrow). B: Onset of disease signs in IHNV-infected larvae. 12 larvae were inoculated at 72 hpf by iv microinjection of ~100 pfu IHNV25 and incubated individually at 24°C. At regular intervals, they were scored under the dissecting scope for possession or loss of three properties, each shown on a separate curve: active blood flow (circles), reactivity to touch (squares), or survival (triangles). All control uninfected larvae (n = 6) remained reactive with strong blood flow during the whole time interval. Experiment repeated three times with comparable results. C. Effect of the dose of injected virus on disease course, using a clinical scoring method. Larvae (77 hpf) were injected with varying doses of IHNV25, incubated individually at 24°C, and regularly checked for survival, blood flow in the tail, and reactivity to touch, to attribute a clinical score to each individual (criteria illustrated on panel B; see >Methods for details). Graph displays mean clinical score for each group; error bars correspond to standard error of the mean (s.e.m). Experiment repeated twice with similar outcome. D and E: Accumulation of erythrocytes in larvae 40 hours after injection of IHNV25. Lateral views, anterior to the left, dorsal to the top; live DIC imaging. Top panel: IHNV-infected larva; bottom panel, uninfected control. C (10x objective) head with erythrocytes accumulated around the eye (arrows). D (20x objective) pericardial cavity. Arrows, erythrocytes. Arrowheads, heart (left arrowhead: ventricle, right arrowhead, atrium. Because different focal planes have been selected to provide the best view of the pericardial cavity, the ventricle is out of focus for the infected larva). Scale bars, 50 μm. |
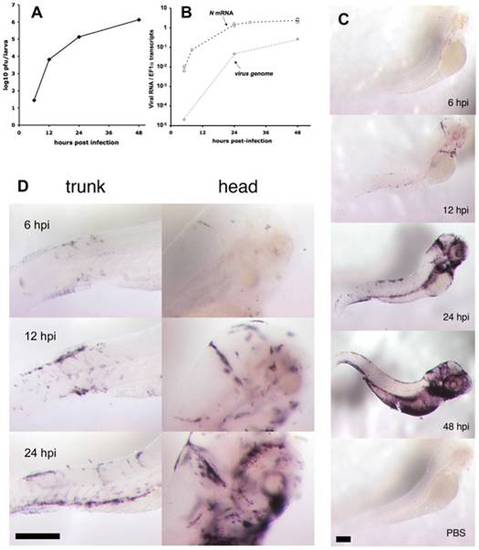
Progress of IHNV infection. A. Quantification of viremia over time. Larvae were inoculated with IHNV as in Figure 1B. At regular intervals, pools of five larvae were snap-frozen, and virus titers measured on a layer of EPC cells. Titers were always below the threshold of detection (5 pfu) in uninfected control larvae. Experiment repeated twice with similar results. B. Assessment of viremia in whole larvae using qRT-PCR. Quantification of N-IHNV transcripts (circles) or viral genomes (diamonds) over housekeeping gene EF1α transcripts. For N-IHNV transcripts, data pooled from five experiments; dashed line join mean values. Viral RNAs were undetectable in control larvae. C. Detection of infected cells using WISH with a N-IHNV-specific probe. Representative images of PTU-treated larvae inoculated as in Figure 1B (or injected iv with PBS for bottom image) and fixed at the indicated times post-infection (24 hpi for PBS control). Magnification: 3.2x. D. details of ISH images at higher (10x) magnification. Scale bars, 200 μm. |
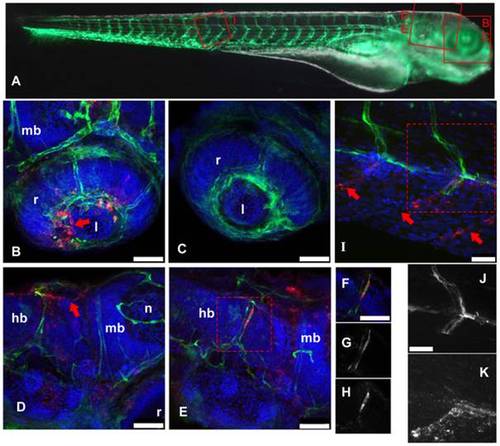
IHNV infects and disrupts blood vessels. A: scheme of the imaged regions (corresponding panel indicated with red letters), overlaid on a composite transmission (grayscale) and GFP fluorescence (green) picture from a 4dpf fli1:GFP larva viewed laterally (images taken with a stereomicroscope; to get a more readable GFP signal, short exposure of the head has been combined with longer exposure of the rest of the body). B–K, confocal images (maximal projections from multiple Z-stacks) of WIHC stainings of fli1:GFP larvae fixed 24 hpi after IHNV inoculation at 72 hpf (except C, uninfected control larva); latero-dorsal views, anterior to right, dorsal to top. Colours in B–F and I: Red: IHNV P protein; green: GFP; blue: nuclei. B: eye, showing disruption of the inner optic circle, with infected cells located close to the damaged site (arrow; compare with C). D and E: brain region of two infected larvae, showing variable pattern. Notice in D the infection and loss of GFP expression of dorsal longitudinal vein (arrow). E shows infection of a cell of the posterior cerebral vein; to demonstrate colocalization of GFP and viral protein, single Z-plane images (cropped to the boxed area in E) are shown in F–H with overlaid signals in F, GFP signal in G, and P-IHNV staining in H. I: view of intersomitic vessels, showing infection and loss of GFP of ventral part of these vessels (arrows indicate where endothelial cells are expected to be found) while the dorsal part appears intact. Partial colocalization of GFP and P-IHNV in the ventral half of one vessel is shown in J and K (GFP and P-IHNV signal channels, respectively). B–H, 40x objective; scale bar, 50 μm. I–K 63x objective; scale bar, 25 µm. hb: hindbrain; l: lens; mb: midbrain; n: neuropile; r: retina. |

IHNV infection destroys vascular endothelium but not erythrocytes. A. Confocal images of representative fli1:GFP fish at 49 hours post inoculation; maximal projection from Z-stacks and mosaic reconstruction. Because of individual variation in GFP expression among fli1:GFP larvae, fluorescence levels have been globally adjusted (here, increased in the IHNV-infected fish) to match in the non-endothelial cells of the pectoral fin that also express GFP. B. Fluorescence (left) and transmission (right) images of gata1:DsRed larvae at 48 hpi, taken with a fluorescence stereomicroscope; exposure settings kept identical for all animals. The two bottom animals have been selected to illustrate the variable distribution of red blood cells immobilized in infected larvae. |
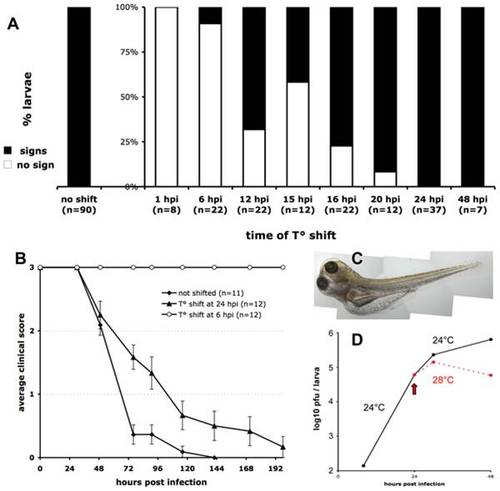
Controlling the progression of IHNV infection by temperature shift. A. Early temperature shifts impairs development of signs of infection in zebrafish larvae inoculated with IHNV25. Larvae (65 to 75 hpf) were infected with 65 to 100 pfu of IHNV25, transferred in individual wells, incubated at 24°C, then shifted to 28°C at the indicated time. They were checked regularly for signs of infection (loss of blood flow or reactivity, gross edemas, death). Larvae that did not develop any sign up to 7 days post-infection were scored as « no sign » (open bars). Results pooled from 8 separate experiments. B. Representative time-course of onset of disease signs in temperature-shifted larvae, in one of the experiments included in A. Clinical scores measured as for Figure 1C; error bars represent s.e.m. C. Photograph of an infected larvae shifted to 28°C at 24 hpi, taken at 72 hpi, showing typical generalized edema. D. Comparison of infectious viral titers in IHNV-infected larvae kept at 24°C (black full line) or shifted to 28°C at 24 hpi (dashed red line). Experiment repeated twice with similar results. |