
|
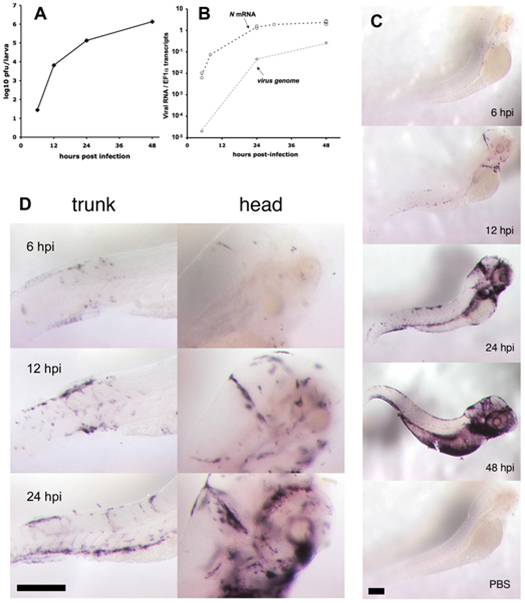
Fig. 2 Progress of IHNV infection.
A. Quantification of viremia over time. Larvae were inoculated with IHNV as in Figure 1B. At regular intervals, pools of five larvae were snap-frozen, and virus titers measured on a layer of EPC cells. Titers were always below the threshold of detection (5 pfu) in uninfected control larvae. Experiment repeated twice with similar results. B. Assessment of viremia in whole larvae using qRT-PCR. Quantification of N-IHNV transcripts (circles) or viral genomes (diamonds) over housekeeping gene EF1α transcripts. For N-IHNV transcripts, data pooled from five experiments; dashed line join mean values. Viral RNAs were undetectable in control larvae. C. Detection of infected cells using WISH with a N-IHNV-specific probe. Representative images of PTU-treated larvae inoculated as in Figure 1B (or injected iv with PBS for bottom image) and fixed at the indicated times post-infection (24 hpi for PBS control). Magnification: 3.2x. D. details of ISH images at higher (10x) magnification. Scale bars, 200 μm.