- Title
-
Highly aneuploid zebrafish malignant peripheral nerve sheath tumors have genetic alterations similar to human cancers
- Authors
- Zhang, G., Hoersch, S., Amsterdam, A., Whittaker, C.A., Lees, J.A., and Hopkins, N.
- Source
- Full text @ Proc. Natl. Acad. Sci. USA
|
Zebrafish MPNSTs are highly aneuploid and heterogeneous. FACS DNA content analysis (A, D, G, and J), metaphase chromosome spreads (B, E, H, and K), and number of chromosomes per cell in 19 normal cells (C) or 100 tumor cells (F, I, and L) from three MPNSTs arising in rp heterozygous fish or from normal tissue, as labeled on the right. Tumors possess an aneuploid peak and usually in addition a 2N peak that is located at around 200 on the x axis. Note that the number of chromosomes per cells varies dramatically within a single tumor. |
|
Array CGH analysis of copy-number changes in zebrafish MPNSTs. Heatmap showing aCGH results indicating relative chromosomal gain (red) and loss (blue) in 36 zebrafish tumor/normal sample pairs across chromosomes 1–25. Thirty-one rp tumor samples are shown on the top and five p53 tumor samples are shown on the bottom. The heatmap is colored according to the segment mean of the data as processed by a circular binary segmentation algorithm, with segment mean values between −0.01 and 0.01 displayed white, and segment mean values between 0.01 (−0.01) and 0.8 (−0.8) displayed in continuous shades of red (blue) on a quasilogarithmic scale (see color band at the bottom). Segment mean values above (below) 0.8 (−0.8) are rendered in the most saturated color value. PHENOTYPE:
|
|
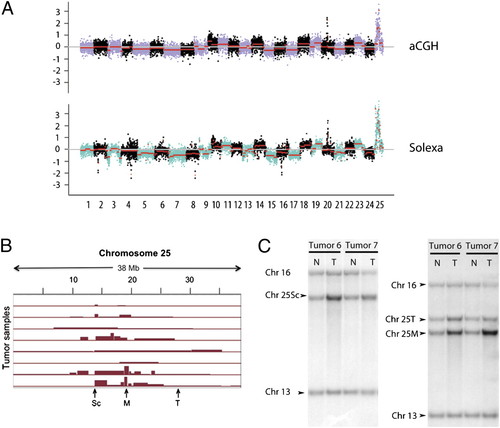
Array CGH results are supported by Illumina sequencing and Southern blot. (A) Postnormalization data of one zebrafish tumor/normal sample pair analyzed by aCGH (Upper) and Illumina sequencing (Lower). The red line indicates the segment mean as obtained by a circular binary segmentation algorithm. Note that the results obtained by these two technologies with respect to both inter- and intrachromosomal changes are largely in agreement. (B) Array CGH analysis demonstrated that 8 of the 36 tumor samples showed subchromosomal amplifications on chromosome 25 beyond the chromosome-level gain. The positions of Southern blot probes to two areas most often overamplified (Sc and M) and an area not additionally amplified (T) are indicated by arrows. (C) Southern blots of the DNA isolated from tails (N) and tumors (T) from 2 of the 14 rp heterozygotes analyzed in this way. Three or four probes were used on each blot; the positions of bands to which probes from chromosomes 13 or 16 or various locations on chromosome 25 as indicated in B hybridized are marked. Note that in tumor 6, all of the chromosome 25 probes show more signal in the tumor sample than the tail sample; in tumor 7, whereas all chromosome 25 probes do so, the increase for the M probe (and to a lesser extent the Sc probe) is greater than that for the T probe. Quantitation for all of the 14 rp heterozygotes and various probes can be found in Figs. S2 and S3. |
|
Overexpression of fgf8a synergizes with mutation of p53 in MPNST development. Kaplan–Meier curves indicate when externally visible tumors were first observed in fish with the indicated genotypes. All fish were progeny of the same four pairs born the same day. Tumor type was confirmed by histological analysis, and fish with neuroblastoma (1 in p53 HOM, HagD1 het, 1 in p53 het, HagD1 het) were excluded from the analysis. No MPNSTs were found in p53 WT, HagD1 heterozygous fish. P values comparing genotyped pairs are shown. PHENOTYPE:
|
|
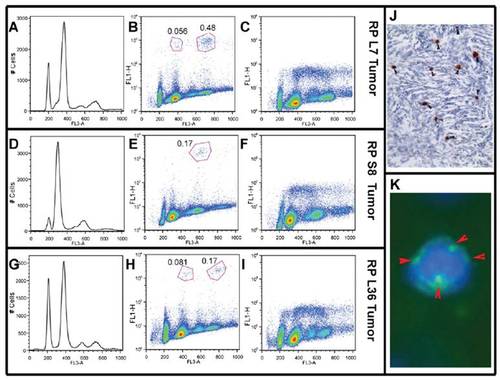
Cell-cycle properties of zebrafish malignant peripheral nerve sheath tumor (MPNST) cells. Results are shown for cells from three different MPNSTs from different rp heterozygotes: rpL7 (A–C), rpS8 (D–F), and rpL36 (G–I). (A, D, and G) DNA content distribution by FACS analysis of propidium iodide (PI)- labeled cells. On the x axis, 200 represents the normal 2N position, which was calibrated by running a mixture of normal and tumor cells. (B, E, and H) FACS analysis of cells double-stained with PI (x axis) and antibody to pH3 (y axis). The mitotic cells are pH3-positive, and are circled in red. The percentages of the cell populations are indicated beside the circles. (C, F, and I) S-phase labeling with a 30-min BrdU pulse. The positions of major horseshoe shapes indicate that the majority of proliferating cells are aneuploid. (J) Histological sections from the rpL35 tumor were stained with antibodies to pH3. Mitotically active tumor cells were stained brown. (K) Tumor cells from rpL35 were double-stained with DAPI and anti-γ-tubulin. The multiple centrosomes are indicated by red arrowheads. |


