
- Title
-
Intermediate filaments of zebrafish retinal and optic nerve astrocytes and Mueller glia: differential distribution of cytokeratin and GFAP
- Authors
- Koke, J.R., Mosier, A.L., and Garcia, D.M.
- Source
- Full text @ BMC Res. Notes
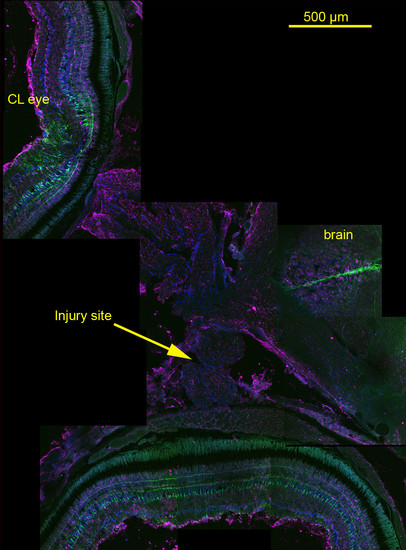
Montage of images showing Tg(gfap:GFP) and cytokeratin localization in the retinas, optic nerves, and a portion of brain obtained from a fish fixed 24 hours post-optic nerve injury. (20x water immersion, NA 0.95). Prominent GFP expression throughout the Müller glia is visible in retinas of eye associated with the injured optic nerve (injury site, arrow) and the contralateral eye (CL eye), and delimiting what appear to be radial glia in a portion of the brain (brain). No GFP expression can be seen in the optic nerve between the retina and optic tract. Cytokeratin (magenta) labeling is apparent in the inner limiting membranes and less intensely in the cytoplasm of cells in the inner plexiform layers of the retinas and in the reticular astrocytes of the optic nerve. Blue label is DAPI indicating nuclei. See Figures 2 and 3 for enlarged views of retina and optic nerve. |
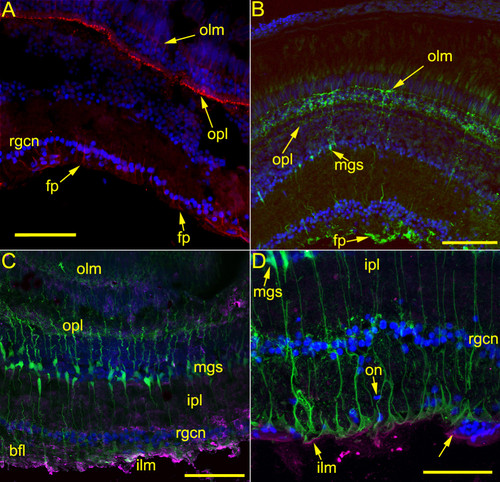
Images of retina from ZDR (A) and Tg(gfap:GFP) (B, C, D) zebrafish showing localization of anti-GFAP, anti-cytokeratin, and GFP. (A, B, C, 20� water immersion, NA 0.95; D 60x oil immersion, NA 1.4). 2A. An image of retina from a ZDR fish immunostained with anti-GFAP (red) and DAPI (blue). Strong labeling in the foot processes (fp) of M�ller glia extending between the RGC nuclei (rgcn) into the inner plexiform layer is apparent. In addition, the Müller glial elements of the outer plexiform layer (opl) are brightly decorated, with fainter labeling extending to the outer limiting membrane. The scale bar represents 55 μm. 2B. Bright GFP fluorescence can be observed in Müller glia extending from the foot processes (fp) at the inner limiting membrane, through the outer plexiform layer (opl), to the outer limiting membrane (olm). The Müller soma (mgs) are visible among the nuclei of the amacrine cells. Note the distribution of GFAP as indicated by anti-GFAP (Figure 2A) is limited to certain regions of the Müller cells and differs from distribution of GFP expressed under a transgene promoter; GFP appears to illuminate all parts of the cell. The scale bar represents 85 μm. 2C. An image of retina from Tg(gfap:GFP) fish has been immunostained for anti-cytokeratin (magenta). As in Figure 2B, GFP fluorescence delineates Müller glia cells from the outer limiting membrane (olm) to the inner limiting membrane (ilm). Bright anti-cytokeratin labeling can be seen on the inner limiting membrane and in the cytoplasm of cells among the bundled fiber layer (bfl). Less intense cytokeratin labeling is apparent in the inner plexiform layer (ipl). The scale bar represents 70 μm. 2D. Similar to Figure 2C, at higher magnification showing details of the inner segments of the Müller glial cells and anti-cytokeratin labeling of the inner limiting membrane (ilm). Oblong nuclei characteristic of oligodendrocytes can be seen in the nerve fiber layer. The arrow at lower right indicates a blood vessel. The scale bar represents 50 μm. |
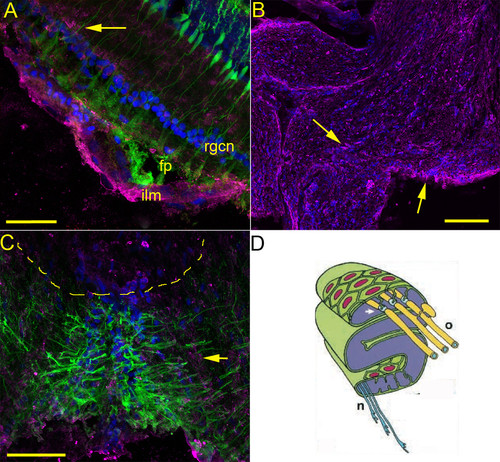
Images of retina from Tg(gfap:GFP) (A, B, C) zebrafish showing localization of anti-cytokeratin and GFP (A, 60x oil immersion, NA 1.4; B, C, 20x water immersion, NA 0.95), and (D) a diagram showing the ribbon structure of zebrafish optic nerve. 3A. A portion of retina labeled with anti-cytokeratin (magenta), DAPI (blue) and GFP. The inner limiting membrane (ilm) appears brightly decorated with anti-cytokeratin, which also less intensely labels cytoplasm of cells in the inner plexiform layer (example at arrow). The foot processes (fp) and inner segments of the M�ller glia cells are illuminated by GFP and the nuclei of the RGCs (rgcn) by DAPI. The calibration bar represents 45 μm. 3B. Image of the optic nerve from the same section as shown in Figures 3A and 3C. Anti-cytokeratin labeling (magenta, arrows) can be seen in the cytoplasm of the optic nerve astrocytes that form the neurolemma of the ribbon-like optic nerve (see Figure 3D). Note the absence of GFP expression. The calibration bar represents 175 μm. 3C shows a section of retina that includes the optic nerve head, with the dotted line highlighting the portion of the section where the optic nerve appears exiting the retina. Cells resembling optic nerve astrocytes showing anti-cytokeratin labeled cytoplasm (magenta; example at arrow) appear to stream from the nerve into the retina. Note how the GFP-expressing Müller glial cells appear to form or strongly interact with the physiological cup of the optic nerve head, but then are excluded from the optic nerve itself. The calibration line represents 50 μm. Figure D is a diagram (adapted with permission from Figure 2D, Macdonald et al. [12]) illustrating the ribbon nature of the nerve, and the reticular astrocytes (green with red nuclei) forming the neurolemma and extending processes to the nodes (arrow, blue) in the myelin sheath formed by oligodendrocytes (O) on the RGC axons (n). The pattern of anti-cytokeratin staining seen in Figure 3B is most consistent with the Macdonald et al. [12] description of optic nerve astrocytes and cytokeratin distribution. |