
- Title
-
Expression of the zebrafish genome during embryogenesis (NIH R01 RR15402)
- Authors
- Thisse, B., Pflumio, S., Fürthauer, M., Loppin, B., Heyer, V., Degrave, A., Woehl, R., Lux, A., Steffan, T., Charbonnier, X.Q. and Thisse, C.
- Source
- Submitted By
- Loppin, Benjamin, Thisse, Bernard, Thisse, Christine (Citing this work)
- Protocol
- Thisse in situ hybridization protocol
- Probe
- cb133 Quality:
- Supplier
-
Supplier: Zebrafish International Resource Center (ZIRC) (order this)
EXPRESSION / LABELING:
|
EXPRESSION / LABELING:
|


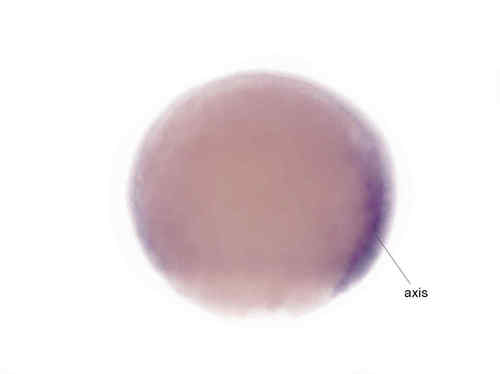
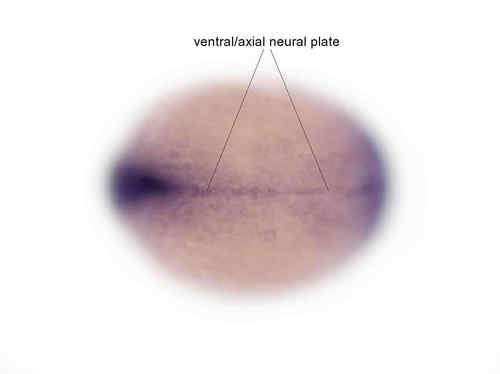
Fig. 3 basal level of expression. Staining more intense in ventral part of the central nervous system (from forebrain to spinal cord). Weak expression in the lateral plate mesoderm. EXPRESSION / LABELING:
|


Fig. 4 basal level of expression in the central nervous system with more staining in telencephalon and anterior diencephalon. Expression also seen in nose. EXPRESSION / LABELING:
|

basal level of expression. Staining more intense at the level of the ventricular zone in the brain |
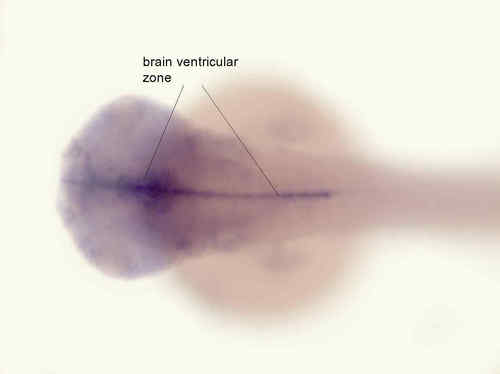
basal level of expression. Staining more intense at the level of the ventricular zone in the brain |