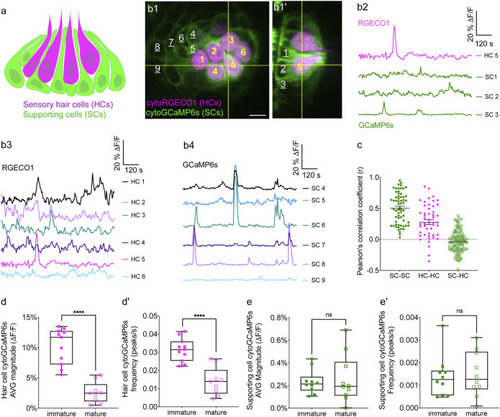
Simultaneous imaging of spontaneous activities in hair cells and supporting cells. (A) Cartoon of a neuromast organ illustrating sensory hair cells (magenta) and the surrounding supporting cells (green). (B1–B1′) High-resolution images taken using two arms of our diSPIM system show a representative, day 3, double transgenic neuromast expressing cytoRGECO1 (hair cells, numbered in yellow) and cytoGCaMP6s (supporting cells, a subset is numbered in white, underscored). A top-down view (B1) and the corresponding side view of its orthogonal projection (B1′) clearly show the hair cells and the surrounding supporting cells at day 3. (B2) Temporal curves of spontaneous calcium activity in hair cell 5 (labeled in B1–B1′) and its three surrounding supporting cells (labeled in B1′) within the 15 min recording window show distinct time courses. (B3) Temporal curves of spontaneous calcium activity in the cluster of six hair cells (labeled in B1) reveals distinct response profiles. (B4) Temporal curves of spontaneous calcium activity in the seven supporting cells (labeled in B1) reveals some correlation and synchronization among neighboring supporting cells. (C) Comparisons of Pearson’s R of spontaneous calcium activities at day 3 in neighboring supporting cells, neighboring hair cells and hair cells with its surrounding hair cells, n = 6 neuromasts for HC-HC or SC-SC R values and n = 4 neuromasts for HC-SC R values. (D–D′) Box plots showing quantification of the average magnitude (D) and frequency (D′) of spontaneous calcium activity in immature (day 3) and mature (day 6) hair cells. (E–E′) Box plots showing quantification of the average magnitude (E) and frequency (E′) of spontaneous calcium activity in supporting cells in mature (day 6) and immature (day 3) neuromasts. Each dot in (D–E′) represents one neuromast. An unpaired t-test was used in (D–E′). ****p < .0001. Scale bar = 5 μm.

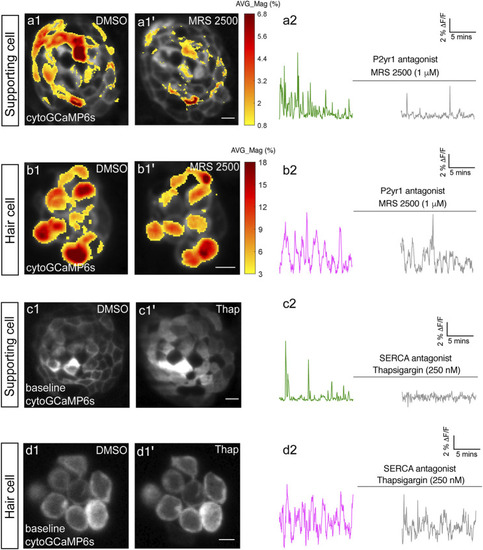
P2yr1 signaling is required for spontaneous activity in supporting cells but not immature hair cells. The spatial patterns of the mean spontaneous calcium activities of the supporting cells (A1–A1′) or hair cells (B1–B1′) in DMSO and after 15 min of treatment with 1 µM MRS2500. Measurements were performed in immature neuromasts at day 3. The ΔF/F GCaMP6s signals were averaged over each 900 s interval (pre- and post-treatment) and then colorized according to the heat map and superimposed onto a baseline image. The corresponding temporal curves of the mean signal magnitude across the whole neuromast in supporting cells (A2) and in hair cells (B2) in DMSO and after 15 min of treatment with 1 µM MRS2500. The cytosolic baseline calcium in the supporting cells (C1–C1′) and hair cells (D1–D1′) in DMSO and after 15 min of treatment with 250 nM Thapsigargin. Measurements were performed in immature neuromasts at day 3. The corresponding temporal curves of the mean signal magnitude across the whole neuromast in supporting cells (C2) and in hair cells (D2) in DMSO and after 15 min of treatment with 250 nM Thapsigargin. Scale bar = 5 μm.

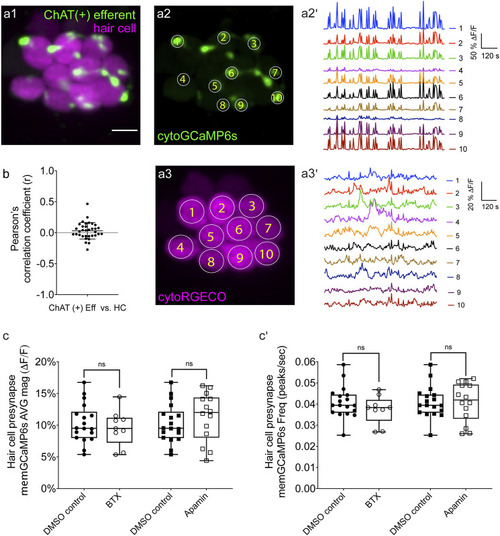
Two-color imaging of spontaneous activities in hair cells and cholinergic efferent terminals. (A1) A representative Max-projection image of a double-transgenic zebrafish line expressing the red GECI cytoRGECO1 in hair cells and the green GECI cytoGCaMP6s in the cholinergic efferents terminals at day 3. (A2) Image depicting cholinergic efferent terminals with individual terminals contacting different hair cells in (A1) are labeled accordingly. (A2′) The corresponding temporal curves of spontaneous calcium activities of the 10 efferent terminals indicated in (A2). (A3) Image of the individual hair cells in a1 labeled according to innervating efferent terminal. (A3′) The corresponding temporal curves of spontaneous calcium activities of the 10 hair cells indicated in (A3). (B) Pearson’s R values of spontaneous calcium activity between each hair cell and its contacting cholinergic efferent terminal, n = 34 hair cell-efferent terminal pairs from four neuromasts at day 3. Box plots showing the average magnitude (C) and frequency (C') of spontaneous calcium activity at the hair cell presynapse in DMSO and after the treatment with 10 μM α-Btx and 10 μM apamin. Each point in (C–C′) represents one neuromast. All measurements were performed in immature neuromasts at day 3. A paired t-test was used in (C–C′). Scale bar = 5 μm.

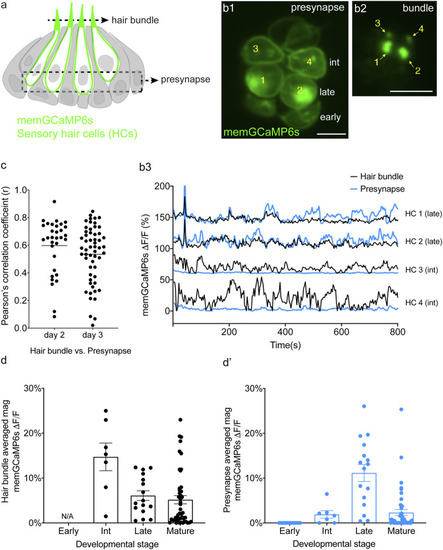
Spontaneous calcium activity occurs in the mechanosensory bundle and at the presynapse. (A) Cartoon of a neuromast organ illustrating hair cells (green) expressing memGCaMP6s, surrounded by supporting cells (gray). (B1) Image of a representative neuromast showing the hair cell presynaptic region indicated by the dashed box in (A) taken from immature hair cells at day 2. Hair cells at three different developmental stages are labeled: early (no detectable hair bundle), intermediate (3, 4), and late (1, 2). (B2) An image of the hair bundles from the same cells as (B1) through the plane indicated by the dash line in (A). (B3) Paired temporal curves of spontaneous calcium activity in hair bundles (B2 black) and the presynaptic regions (B1 blue) taken from the same hair cells. (C) Pearson’s R values of spontaneous calcium activity between hair bundles and the presynaptic regions of the same sets of immature hair cells, n = 32 hair cells (n = 6 neuromasts), day 2 and n = 56 hair cells (n = 6 neuromasts), day 3. (D,E) The average magnitude of spontaneous calcium activity in hair bundles (D) and presynaptic region (E) in the same set of hair cells during the progressive stages of development: early, intermediate, late and mature. No activity can be measured in early hair bundles (N/A) as the bundles are not yet detectable. The spontaneous calcium activity in hair bundles peaks at the intermediate stage (D) and decreases upon maturation, while spontaneous calcium activity in the presynaptic regions peaks at the late stage (D′) and decreases upon maturation. Scale bar = 5 μm.

Spontaneous calcium activity at the presynapse requires CaV1.3 channels. (A) Diagram illustrating the hair cells with the hair bundles highlighted by a dashed box where we measure their spontaneous calcium activity. The structure of a single ribbon synapse at the base of a hair cell is illustrated, as well as the calcium channels beneath it. (B–D) Representative memGCaMP6s temporal traces show that disruption of CaV1.3a channels using cav1.3a mutants (B,C) or pharmacological block using 10 µM isradipine (D) does not impact spontaneous activity in apical hair bundles. (E) Diagram illustrating the hair cells with the presynaptic area highlighted by a dashed box where we measure the spontaneous presynaptic calcium activity. (F–H) Representative memGCaMP6s temporal traces show that disruption of calcium channels using cav1.3a mutants (F–G) or pharmacological block using 10 µM isradipine (H) completely blocked spontaneous activity at the hair cell presynapse. All measurements were performed in immature hair cells at day 3.

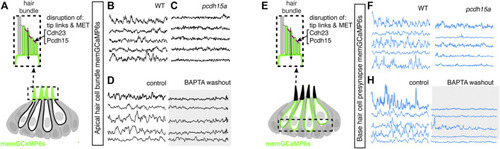
Mechanotransduction in hair bundles is required for spontaneous activity at the presynapse. (A) Diagram illustrating the hair cells with the hair bundles highlighted by a dashed box where we measure their spontaneous calcium activity. The structure of the hair bundle from a single hair cell at is illustrated on top. The mechanotransduction (MET) channels are gated by tip links made up of Pcdh15a Cdh23. Pharmacological application of BAPTA, an extracellular calcium chelator, breaks tip links and acutely disrupts MET function. (B–D) Representative GCaMP6s temporal traces show that disruption of tip links using pcdh15a mutants (B,C) or by pharmacologically disrupting tip links using BAPTA (D) disrupts spontaneous activity in hair bundles. (E) Diagram illustrating the hair cells with the hair cell presynaptic area highlighted by a dashed box at the base of the hair cells where we measure the spontaneous presynaptic calcium activity. (E–H) Representative GCaMP6s temporal traces show that disruption of tip links using pcdh15a mutants (F–G) or by pharmacologically disrupting tip links using BAPTA (H) also disrupts spontaneous calcium activity at the presynapse. All measurements were performed in immature hair cells at day 3.

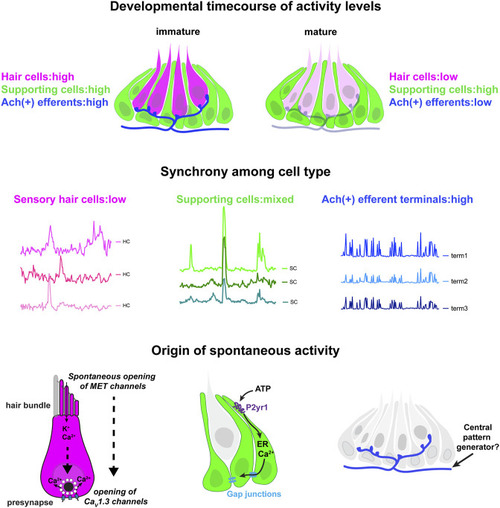
Locations, mechanisms and developmental timecourse of spontaneous calcium activities in the lateral-line system. Top panel: we reliably detected spontaneous calcium activity in three cell types within the lateral-line system: hair cells, supporting cells and cholinergic (Ach (+)) efferent neurons. Spontaneous calcium activity in the supporting cells and cholinergic efferents is not correlated with calcium signals in hair cells. During development spontaneous calcium signals are robust in all three cell types (left side). Upon maturation, spontaneous calcium signals are decreased in hair cells and efferent neurons, but maintained in supporting cells (right side). Middle panel: Within a neuromast spontaneous calcium signals among populations of hair cells are not correlated (left side); supporting cells are moderately correlated (middle); cholinergic terminals are highly correlated (right side). Bottom panel: In developing hair cells, spontaneous opening of MET channels leads to calcium signals in mechanosensory hair bundles. This apical activity triggers opening of CaV1.3 channels at the presynapse, resulting in spontaneous presynaptic calcium signals (left side). In supporting cells, extracellular ATP acts on P2yr1 receptors. P2yr1 signaling leads to calcium release from the ER, giving rise to a spontaneous calcium signal. Spontaneous calcium signals can be propagated to neighboring supporting cells via gap junction channels (middle). Spontaneous activity in cholinergic efferents may be coupled to activity in spinal motor neurons that is present during development in order to form the central pattern generator required for locomotion (right side).

Acknowledgments
This image is the copyrighted work of the attributed author or publisher, and ZFIN has permission only to display this image to its users. Additional permissions should be obtained from the applicable author or publisher of the image. Full text @ Front Cell Dev Biol