- Title
-
Rough and smooth variants of Mycobacterium abscessus are differentially controlled by host immunity during chronic infection of adult zebrafish
- Authors
- Kam, J.Y., Hortle, E., Krogman, E., Warner, S.E., Wright, K., Luo, K., Cheng, T., Manuneedhi Cholan, P., Kikuchi, K., Triccas, J.A., Britton, W.J., Johansen, M.D., Kremer, L., Oehlers, S.H.
- Source
- Full text @ Nat. Commun.
|
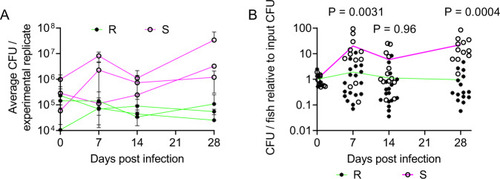
M. abscessus establishes chronic infection in adult zebrafish.
A Enumeration of CFUs from adult zebrafish infected with either the R or the S variant of M. abscessus. Each point represents a single experimental replicate with at least three animals per timepoint. Total n per timepoint: 0 dpi R = 13 S = 12; 7 dpi R = 18 S = 12; 14 dpi R = 17 S = 13; 28 dpi R = 15 S = 12. B Relative CFUs recovered from adult zebrafish infected with either the R or the S variant of M. abscessus. Absolute CFU values were normalised to the inoculum CFU for each experimental replicate. Data are pooled from three replicates per M. abscessus variant. Total n per timepoint: 0 dpi R = 13 S = 12; 7 dpi R = 18 S = 12; 14 dpi R = 17 S = 13; 28 dpi R = 15 S = 12. Statistical tests by two-sided Student?s t test at each timepoint. Data are presented as mean values ± SD. Source data are provided as a Source Data file. PHENOTYPE:
|
|
Granuloma histopathology is accelerated during M. abscessus R infection compared to S.
A Stereotypical examples of bacterial lesions from DAPI-stained sections from adult zebrafish infected with M. abscessus expressing tdTomato. Top row infected with the rough variant, bottom row infected with the smooth variant, timepoints as indicated. Images are representative of the two experimental replicates quantified in B, C. Scale bars indicate 200 ?m. Filled arrowheads indicate epithelised macrophage nuclei forming a stereotypical concentric layer surrounding the mycobacterial core of necrotic granulomas, * indicate necrotic cores. B Quantification of bacterial lesion necrosis in adult zebrafish infected with approximately 105 CFU M. abscessus. Each data point represents the proportion of lesions from a single animal. C Quantification of bacterial burden stratified by lesion necrosis in adult zebrafish infected with either the R or the S variant of M. abscessus. Each data point represents the proportion of lesions from a single animal. Total individual lesions and animals analysed in B and C pooled from two experimental replicates (necrotic/unorganised/animals): 10 dpi R (37/228/4); 10 dpi S (107/788/5); 14 dpi R (299/447/18); 14 dpi S (111/539/17); 28 dpi R (149/217/10); 28 dpi S (382/603/16). Statistical testing by two-sided ANOVA. Data are presented as mean values ± SD. Source data are provided as a Source Data file. PHENOTYPE:
|
|
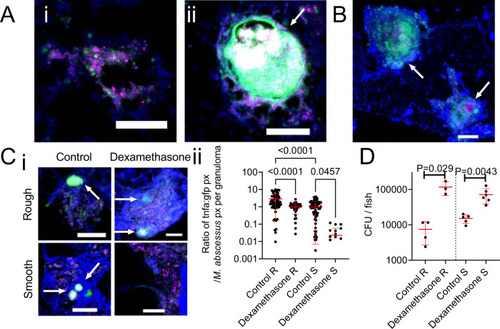
Host tnfa expression is driven by M. abscessus infection and control of M. abscessus infection is sensitive to immunosuppression by dexamethasone.
A Examples of R variant M. abscessus-tdTomato lesions in DAPI-stained cryosections from a 14 dpi TgBAC(tnfa:GFP)pd1028 adult zebrafish. i. Cellular lesion, ii. Necrotic granuloma. Arrow indicates necrotic granuloma, M. abscessus-tdTomato is coloured magenta, tnfa promoter induction is marked in green. Scale bars indicate 100 ?m. Images are representative of two biological replicates of 3 animals per replicate. B Examples of S variant M. abscessus-tdTomato lesions in DAPI-stained cryosections from a 28 dpi TgBAC(tnfa:GFP)pd1028 adult zebrafish. Arrows indicate necrotic granulomas, M. abscessus-tdTomato is coloured magenta, tnfa promoter induction is marked in green. Scale bar indicates 100 ?m. Images are representative of two biological replicates of 3 animals per replicate. C i. Examples of tnfa promoter activity in 14 dpi TgBAC(tnfa:GFP)pd1028 adult zebrafish infected with M. abscessus-tdTomato and treated with dexamethasone as indicated. Arrows indicate necrotic granulomas, M. abscessus-tdTomato is coloured magenta, tnfa promoter induction is marked in green. Scale bars indicate 100 ?m. Control images are representative of 3 animals per M. abscessus variant, dexamethasone images are representative of 2 animals per M. abscessus variant. ii. Quantification of GFP pixels as a function of M. abscessus-tdTomato fluorescence in TgBAC(tnfa:GFP)pd1028 adult zebrafish. Data are a single experimental replicate, each point represents a single granuloma, total animals per group: Control R = 3, Dexamethasone R = 2, Control S = 3, Dexamethasone S = 3. Statistical testing by two-sided ANOVA. D Enumeration of CFUs from adult zebrafish infected with either the R or the S variant of M. abscessus and treated with dexamethasone. Each point represents a single animal and data are representative of 2 biological replicates. Total number of animals: Control R = 4, Dexamethasone R = 3, Control S = 5, Dexamethasone S = 6. Statistical testing by two-sided Student?s t test within each of the independent R and S experiments. Data are presented as mean values ± SD. Source data are provided as a Source Data file. |
|
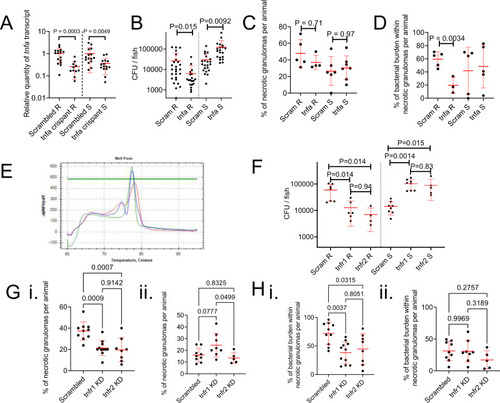
Host TNF drives M. abscessus R granuloma expansion and control of M. abscessus S infection.
A Quantification of tnfa transcripts activity in 14 dpi zebrafish injected with scrambled control or tnfa-targeting gRNA-Cas9 complexes. Each data point represents a single animal, data are pooled pooled from 2 biological replicates, total number of animals: Scrambled R = 16, tnfa crispant R = 11, Scrambled S = 15, tnfa crispant S = 15. Statistical testing by two-sided Student?s t test within each of the independent R and S experiments. B Enumeration of CFUs from tnfa crispant adult zebrafish infected with 104 CFU of either the R or the S variant of M. abscessus. Each data point represents a single animal, data are pooled from 3 biological replicates, total number of animals: Scrambled R = 26, tnfa crispant R = 19, Scrambled S = 22, tnfa crispant S = 20. Statistical testing by two-sided Student?s t test within each of the independent R and S experiments. C Quantification of bacterial lesion necrosis in tnfa crispant adult zebrafish infected with M. abscessus. Each data point represents the proportion of lesions from a single animal. Statistical testing by two-sided ANOVA. D Quantification of bacterial burden stratified by lesion necrosis in tnfa crispant adult zebrafish infected with M. abscessus. Each data point represents the proportion of lesions from a single animal. Total individual lesions and animals analysed in C, D (necrotic/unorganised/animals): Scrambled R (43/51/5); tnfa crispant R (12/21/3); Scrambled S (25/43/5); tnfa crispant S (57/96/5). Statistical testing by two-sided ANOVA. E Example of high resolution melt analysis of the first tnfr2 CRISPR target site in 14 dpi zebrafish injected with scrambled control (blue), tnfr1 (green), or tnfr2 (red)-targeting gRNA-Cas9 complexes. F Enumeration of CFUs from tnfr1 and tnfr2 crispant adult zebrafish infected with 104 CFU of either the R or the S variant of M. abscessus. Each data point represents a single animal, data are representative of 3 biological replicates. Statistical testing by two-sided ANOVA within each of the independent R and S experiments. Total number of animals (Scram/tnfr1/tnfr2): R = 7/6/4, S = 8/8/5. G Quantification of bacterial lesion necrosis in tnfr1 and tnfr2 crispant adult zebrafish infected with M. abscessus. Each data point represents the proportion of lesions from a single animal. H. Quantification of bacterial burden stratified by lesion necrosis in tnfr1 and tnfr2 crispant adult zebrafish infected with M. abscessus. Each data point represents the proportion of lesions from a single animal. Total individual lesions and animals analysed in G, H (necrotic/unorganised/animals): Scrambled R (91/224/10); tnfr1 crispant R (89/308/11); tnfr2 crispant R (40/173/8); Scrambled S (25/139/9); tnfr1 crispant S (40/143/8); tnfr2 crispant S (17/97/5). Statistical testing by two-sided ANOVA. Data are presented as mean values ± SD. Source data are provided as a Source Data file. PHENOTYPE:
|
|
T cell-mediated immunity differentially controls infection by M. abscessus variants.
A Examples of T cell recruitment to granulomas in 14 dpi TgBAC(lck:EGFP)vcc4 adult zebrafish infected with R M. abscessus-tdTomato. B Example of lack of T cell recruitment to S M. abscessus- tdTomato in a large cellular lesion from a 14 dpi TgBAC(lck:EGFP)vcc4 adult zebrafish. Scale bars indicate 200 ?m. Arrows indicate necrotic granulomas, M. abscessus-tdTomato is coloured magenta, lck:gfp positive T cells are marked in green. Images from A and B are representative of the dataset analysed in C. C Quantification of T cell GFP pixels as a function of M. abscessus-tdTomato fluorescence in TgBAC(lck:EGFP)vcc4 adult zebrafish. Each point represents a single lesion. Total n per group (lesions/animals): 14 dpi R = 74/2, S = 137/3; 28 dpi R = 91/3, S = 117/2. D Survival analysis of WT and lck?/? sa410 adult zebrafish infected with R or S M. abscessus. Total n = 12 WT/Mabs R; 16 lck?/?/Mabs R; 15 WT/Mabs S; 22 lck?/?/Mabs S. E Normalised CFUs recovered from 14 dpi WT and lck?/? sa410 adult zebrafish infected with M. abscessus. Each point represents the average of a single experiment with at least 2 animals per group. Total n per group: R WT = 12 lck?/? = 15; S WT = 11 lck?/? = 12. Statistical testing by two-sided ANOVA. Data are presented as mean values ± SD. Source data are provided as a Source Data file. |
|
Regulatory T cells interact with rough M. abscessus granulomas to control infection burden.
A Example of Treg recruitment to a necrotic R M. abscessus- wasabi granuloma in 14 dpi TgBAC(foxp3a:TagRFP,cryaa:EGFP)vcc3 adult zebrafish. B Example of Treg recruitment to a necrotic S M. abscessus- wasabi granuloma from a 28 dpi TgBAC(foxp3a:TagRFP,cryaa:EGFP)vcc3 adult zebrafish. Scale bars indicate 50 ?m. M. abscessus-wasabi is coloured green, foxp3a:TagRFP positive Treg are marked in magenta. Images from A and B are representative of the dataset analysed in C. C Quantification of Treg RFP pixels as a function of M. abscessus-wasabi fluorescence in TgBAC(foxp3a:TagRFP,cryaa:EGFP)vcc3 adult zebrafish. Each point represents a single lesion. Total n per group (lesions/animals): 14 dpi R = 26/4, S = 55/3; 28 dpi R = 66/3, S = 29/3. Statistical testing by 2-way ANOVA. D Enumeration of CFUs from foxp3avcc6 mutant adult zebrafish infected with 2 × 10⁴ CFU M. abscessus R. Each data point represents a single animal, data are representative of two biological replicates. Statistical testing by two-sided T test. Total number of animals: WT = 9, foxp3a?/? = 12. E Quantification of bacterial lesion necrosis in foxp3avcc6 mutant adult zebrafish infected with M. abscessus R. Each data point represents the proportion of lesions from a single animal. F Quantification of bacterial burden stratified by lesion necrosis in foxp3avcc6 mutant adult zebrafish infected with M. abscessus R. Each data point represents the proportion of lesions from a single animal. Total individual lesions and animals analysed in E, F (necrotic/unorganised/animals): WT (35/91/5); foxp3avcc6 mutant (22/97/4). Statistical testing by two-sided T test. Data are presented as mean values ± SD. Source data are provided as a Source Data file. PHENOTYPE:
|


