
Fig. 4
- ID
- ZDB-IMAGE-220307-13
- Publication
- Kam et al., 2022 - Rough and smooth variants of Mycobacterium abscessus are differentially controlled by host immunity during chronic infection of adult zebrafish
- All Figures
- Figures for Kam et al., 2022
|
Fig. 4
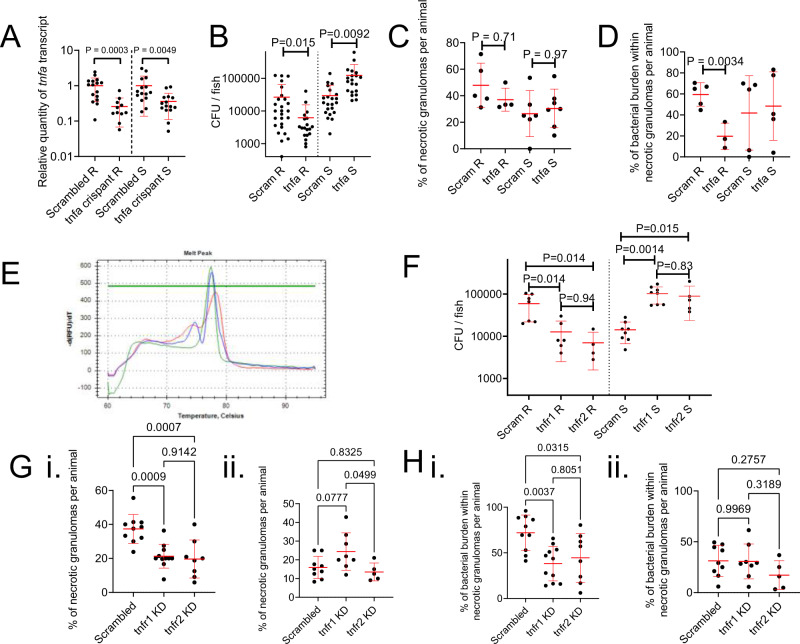
A Quantification of tnfa transcripts activity in 14 dpi zebrafish injected with scrambled control or tnfa-targeting gRNA-Cas9 complexes. Each data point represents a single animal, data are pooled pooled from 2 biological replicates, total number of animals: Scrambled R = 16, tnfa crispant R = 11, Scrambled S = 15, tnfa crispant S = 15. Statistical testing by two-sided Student’s t test within each of the independent R and S experiments. B Enumeration of CFUs from tnfa crispant adult zebrafish infected with 104 CFU of either the R or the S variant of M. abscessus. Each data point represents a single animal, data are pooled from 3 biological replicates, total number of animals: Scrambled R = 26, tnfa crispant R = 19, Scrambled S = 22, tnfa crispant S = 20. Statistical testing by two-sided Student’s t test within each of the independent R and S experiments. C Quantification of bacterial lesion necrosis in tnfa crispant adult zebrafish infected with M. abscessus. Each data point represents the proportion of lesions from a single animal. Statistical testing by two-sided ANOVA. D Quantification of bacterial burden stratified by lesion necrosis in tnfa crispant adult zebrafish infected with M. abscessus. Each data point represents the proportion of lesions from a single animal. Total individual lesions and animals analysed in C, D (necrotic/unorganised/animals): Scrambled R (43/51/5); tnfa crispant R (12/21/3); Scrambled S (25/43/5); tnfa crispant S (57/96/5). Statistical testing by two-sided ANOVA. E Example of high resolution melt analysis of the first tnfr2 CRISPR target site in 14 dpi zebrafish injected with scrambled control (blue), tnfr1 (green), or tnfr2 (red)-targeting gRNA-Cas9 complexes. F Enumeration of CFUs from tnfr1 and tnfr2 crispant adult zebrafish infected with 104 CFU of either the R or the S variant of M. abscessus. Each data point represents a single animal, data are representative of 3 biological replicates. Statistical testing by two-sided ANOVA within each of the independent R and S experiments. Total number of animals (Scram/tnfr1/tnfr2): R = 7/6/4, S = 8/8/5. G Quantification of bacterial lesion necrosis in tnfr1 and tnfr2 crispant adult zebrafish infected with M. abscessus. Each data point represents the proportion of lesions from a single animal. H. Quantification of bacterial burden stratified by lesion necrosis in tnfr1 and tnfr2 crispant adult zebrafish infected with M. abscessus. Each data point represents the proportion of lesions from a single animal. Total individual lesions and animals analysed in G, H (necrotic/unorganised/animals): Scrambled R (91/224/10); tnfr1 crispant R (89/308/11); tnfr2 crispant R (40/173/8); Scrambled S (25/139/9); tnfr1 crispant S (40/143/8); tnfr2 crispant S (17/97/5). Statistical testing by two-sided ANOVA. Data are presented as mean values ± SD. Source data are provided as a Source Data file.