- Title
-
A controllable on-off strategy for the reproductive containment of fish
- Authors
- Zhang, Y., Chen, J., Cui, X., Luo, D., Xia, H., Dai, J., Zhu, Z., Hu, W.
- Source
- Full text @ Sci. Rep.
|
The down-regulation of dnd results in the disrupted migration and reduced number of PGCs in the TG3 embryos. The mRNA level of (a) dnd, (b) nanos1, (c) tdrd7 in the TG3 and the WT embryos at the 1-cell, 1k-cell, oblong, 50%-epiboly, and 3-somite embryonic stages, validated by quantitative Q-PCR. The 2ΔCt values were plotted as the relative mRNA level normalized to odc1. Values are represented as the mean ± SEM. of five repeats. *P < 0.05, ** P < 0.01. (d) Vasa-positive PGCs were found close to the yolk syncytial layer (YSL) in the WT embryos. At 4.3 hours post-fertilization (hpf) some PGCs (indicated by arrows) were far from the YSL in the TG3 embryos. (e) The number of vasa-positive PGCs decreased in the TG3 embryos compared with the WT embryos at 20 hpf and 24 hpf in the dorsal view. (Scale bars: 100 µm). |
|
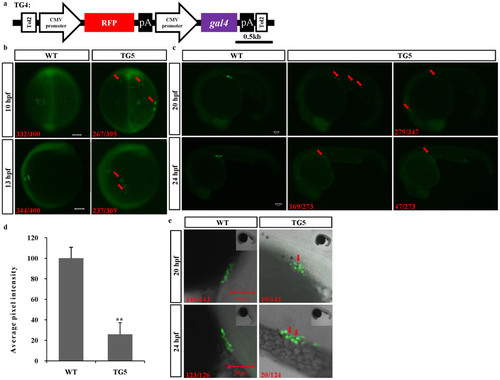
Validation of the migration, number and apoptosis of PGCs in the TG5 and the WT embryos. (a) Schematic of the expression gene cassette of the plasmids used to establish the TG4 line. (b) A part of PGCs labeled by GFP (red arrows) migrated abnormally or lagged behind in the TG5 embryos at 10 hpf and 13 hpf, compared with the WT embryos. (c) The number of PGCs decreased in the TG5 embryos at 20 hpf and 24 hpf compared with the WT embryos. The red arrow indicates the location of PGCs. (d) WT embryos contained approximately four times the number of PGCs as the TG5 embryos (detected by GFP fluorescence intensity of PGCs at 24 hpf (n = 10). (e) Apoptosis of some PGCs was detected (red arrows) within some of the TG5 embryos. (Scale bars: 100µm). |
|
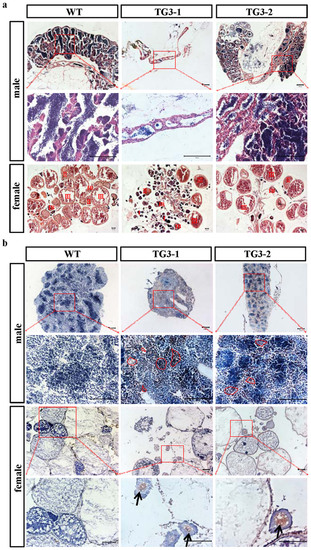
Histology and apoptosis analysis of the gonads of the TG3 adults. (a) Histology of the testes and ovaries from WT, TG3-1 and TG3-2 individuals by HE staining at 4.5 months of age. The lobular cavities in gonad of TG3-1 and TG3-2 males were observed to be in a single-row, were smaller than those of the WT males and contained none or very few mature sperm. When compare to the WT females, most oocytes were at stage I and widely dispersed throughout the gonads of the TG3-1 female fish, and at stage III and loosely arrayed in the gonads of the TG3-2 females. (b) Results of TUNEL staining of the testes and ovaries from the WT, TG3-1 and TG3-2 individuals. Multiple clusters of apoptotic spermatocytes were present in the testes of TG3-1 and TG3-2 males and some apoptotic oocytes were also present in the ovaries of TG3-1 and TG3-2 females. The red dotted line and black arrows indicate germ cells that were undergoing apoptosis. (Scale bars: 100µm). |
|
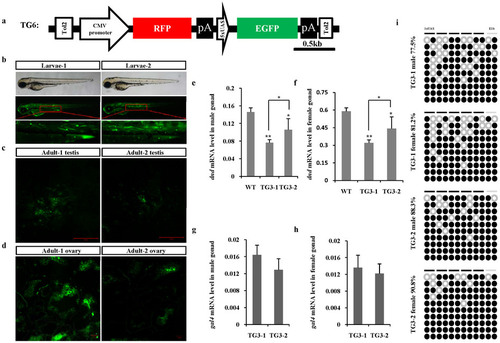
Mosaic expression of egfp regulated by 5 × UAS and methylation analysis of 5 × UAS-E1b by bisulfite sequencing. (a) Schematic of the expression gene cassette of the plasmids used to establish the TG6 line. (b) Variable mosaic expression of the 5 × UAS-regulated egfp gene was detected in the offspring of the TG4 and TG6 lines (at 60 hpf). The variable mosaic expression of the 5 × UAS-regulated egfp gene was detected in (c) the testes and (d) the ovaries of the offspring of the TG4 and the TG6 lines (at 3 months of age). (Scale bars: 100 µm). The expression of dnd in (e) the male gonads and (f) female gonads of the WT, TG3-1 and TG3-2 lines was validated by quantitative PCR (Q-PCR). The expression of gal4 in (g) the male gonads and (h) the female gonads of TG3-1 and TG3-2 individuals was validated by Q-PCR. The 2-ΔCt values were plotted as the relative mRNA level normalized to odc1. Values are represented as the mean ± SEM of four repeats. *P < 0.05, ** P < 0.01. (i) DNA from the gonads of the TG3-1 and TG3-2 adults (at 4.5 months of age) was subjected to bisulfite sequencing. CpG methylation patterns in the 5 × UAS-E1b are indicated on the horizontal axis. The first ten CpG sites resided within the 5 × UAS, the last two CpGs sites resided within the E1b promoter. Ten clones were tested and the results are shown on the vertical axis. Black circles represent methylated sites. |


