
- Title
-
Scales of fish arise from mesoderm
- Authors
- Mongera, A., and Nüsslein-Volhard, C.
- Source
- Full text @ Curr. Biol.
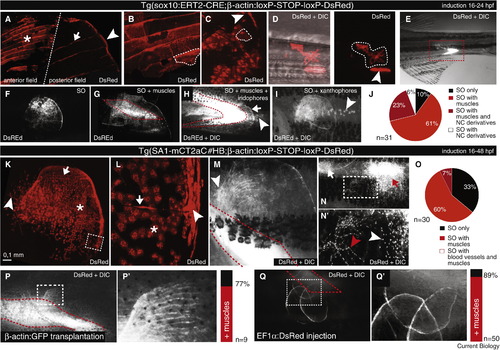
Mesoderm-derived scale osteoblasts. (A–J) sox10:ERT2-Cre-mediated cell labeling. (A) Labeled SOs along the serrations (asterisk), the radii (arrow) and at the margin (arrowhead). (B) Labeled SOs covering the scale outer surface in the anterior field and (C) in the posterior field. Representative cell shapes are highlighted by dashed insets. The arrowhead in (C) highlights SOs at the posterior scale margin. (D) Labeled neural crest-derived cell types (dashed inset) and mesodermal derivatives (muscle fiber, arrowhead) in the trunk of 5 days post-fertilisation larvae. (E) Somitic muscle clone in adult fish. (F) SO clone. (G) SOs and somatic muscles (dashed inset). (H) SOs, somatic muscles (red dashed inset), and iridophores (arrowhead). (I) SOs and xanthophores (arrowhead). (J) Analysis of clonal association between labeled scales (n = 31) and neural crest-/mesoderm-derived tissues. (K–O) SA1-mCT2aC#HB-mediated cell labeling. (K) Scale clone with labeled fibroblast-like cells (arrowhead) and scale osteoblasts (SOs) along the serrations (arrow) and on the outer surface of the posterior field (asterisk). (L) Magnification of the inset in (K) showing labeled SOs along the radii (arrow), covering the scale surface (asterisk), and at the scale margin (arrowhead). (M) Recombined SOs associated with recombined muscles. (N,N′) Recombined SOs associated with recombined blood vessels. (N) Labeled SOs along the serrations (white arrow) and on the scale surface (red arrow). (N′) Magnification of the inset in (N) showing recombined blood vessels (red arrowhead) and fibroblast-like cells (white arrowhead). (O) Analysis of clonal association between labeled scales (n = 30), muscles and blood vessels. (P,P′) Independent validation of SO/muscle clonal association by blastula transplantation (77%; n = 9) and (Q,Q′) transposon-based clonal insertion (89%; n = 50). (P′,Q′) are magnifications of the insets in (P) and (Q), respectively. |

Gross anatomy of the scale and different populations of scale-forming osteoblasts. (A) The scale is divided into two fields (border defined by the white dashed line): the anterior (left) and the posterior (right) field. The anterior field is overlapped by the preceding and neighbouring scales and is characterized by a focus (f), representing the growth centre of the scale, and serrations (s), concentric thickenings of the bony surface disposed around the focus. The posterior field is exposed and covered on both sides by the epidermis. The radii (r), grooves along the scale surface, originate from the focus and reach the posterior margin perpendicularly. Circuli (c) are semi-circular undulations which parallel the posterior margin and mark growth stages. The red insets highlight the regions depicted in (B-D). (A′) Imbrication of two consecutive scales. (B-D) Maximum intensity projection (MIP) of DAPI and phalloidin stainings of scale. (B) Highly compacted osteoblasts stretched along the scale margin. (C) Osteoblasts along the serrations, covering the scale surface in the region of the anterior field. The nuclei are located along the ridges and the cell bodies have ‘closet’ structures filling the areas between neighbouring serrations. (D) Osteoblasts in the posterior field located along the grooves (arrow) and along the circuli (arrowhead). (E-E′ ′) Different populations of osteoblasts on scale of Tg(SA1-mCT2aC#HB;βactin: switch) fish where the recombination was induced between 16 and 48 hpf. (E) MIP of 2-photon stacks showing DsRed+ osteoblasts along the serrations (filled arrowhead), on the surface of the posterior field (arrow), along the grooves (empty arrowhead), and along the circuli depressions (asterisks). (E′) MIP of second harmonic generation (SHG) stacks showing the scale osseous layer. Groove of a radius (empty arrowhead) and circulus depression (asterisk). (E′ ′) Merge of (E-E′). EXPRESSION / LABELING:
|

Examples of clonal association of muscles and scale osteoblasts. (A-E′) Stereomicroscope pictures showing clonal association of scales and muscles in induced Tg(SA1-mCT2aC#HB;β-actin:switch) adult fish. Scales with recombined osteoblasts are highlighted in red; dashed red lines show the contour of muscle clones. (F-J′) Stereomicroscope pictures showing transposon-based clonal association of scales and muscles in adult fish. The white, dashed insets highlight the regions depicted with higher magnification on the right column. The contour of muscle clones is shown by dashed red lines. F′) Osteoblasts at the posterior margin. G′) Osteoblasts along the serrations (white arrowhead), on the outer surface of the posterior field (asterisk), in the radii grooves (red arrowhead), and at the posterior margin (arrow). H′) Osteoblasts covering the posterior outer surface of the scale. I′) Osteoblasts on the posterior scale outer surface and along the serrations (arrowhead). J′) Osteoblasts along the serrations (arrowhead). EXPRESSION / LABELING:
|