
|
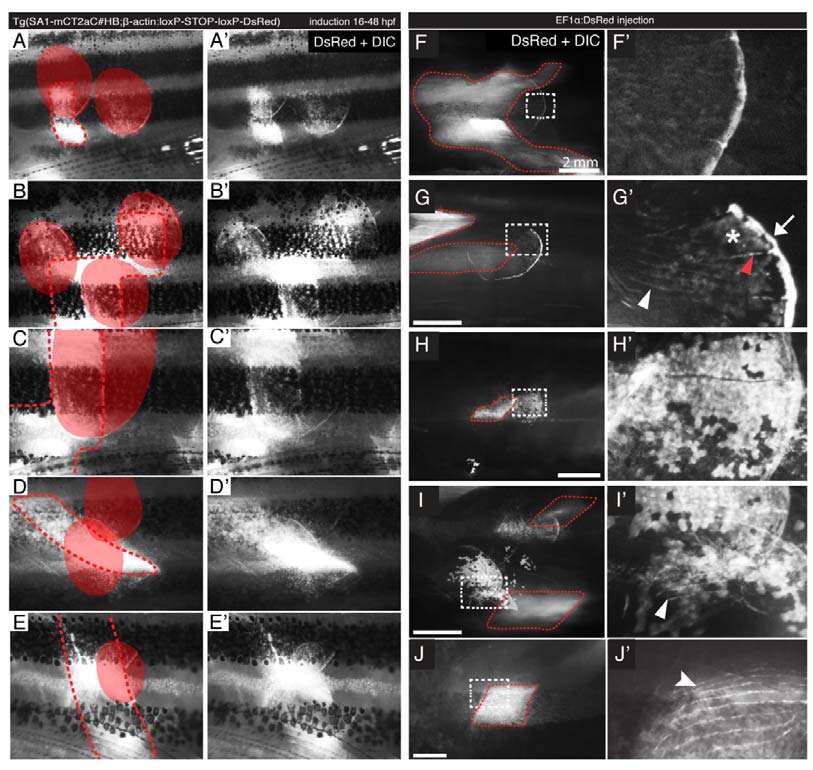
Fig. S2 Examples of clonal association of muscles and scale osteoblasts.
(A-E′) Stereomicroscope pictures showing clonal association of scales and muscles in induced Tg(SA1-mCT2aC#HB;β-actin:switch) adult fish. Scales with recombined osteoblasts are highlighted in red; dashed red lines show the contour of muscle clones. (F-J′) Stereomicroscope pictures showing transposon-based clonal association of scales and muscles in adult fish. The white, dashed insets highlight the regions depicted with higher magnification on the right column. The contour of muscle clones is shown by dashed red lines. F′) Osteoblasts at the posterior margin. G′) Osteoblasts along the serrations (white arrowhead), on the outer surface of the posterior field (asterisk), in the radii grooves (red arrowhead), and at the posterior margin (arrow). H′) Osteoblasts covering the posterior outer surface of the scale. I′) Osteoblasts on the posterior scale outer surface and along the serrations (arrowhead). J′) Osteoblasts along the serrations (arrowhead).