
- Title
-
Stereotypical Cell Division Orientation Controls Neural Rod Midline Formation in Zebrafish
- Authors
- Quesada-Hernández, E., Caneparo, L., Schneider, S., Winkler, S., Liebling, M., Fraser, S.E., and Heisenberg, C.P.
- Source
- Full text @ Curr. Biol.
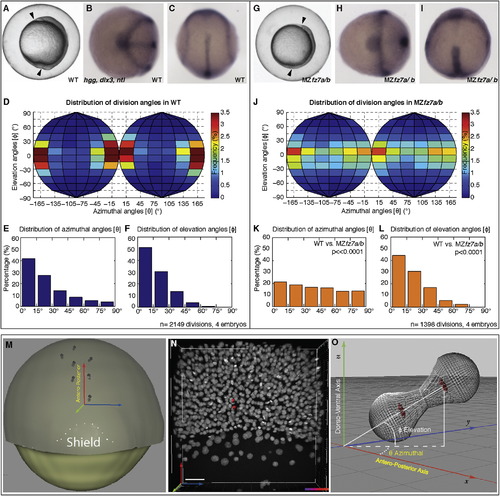
MZfz7a/b Double Mutants Exhibit Reduced CE Movements and Reduced Stereotypical Germ-Layer Progenitor Cell Division Orientation (A and G) Differential interference contrast (DIC) images of a wild-type (A) and MZfz7a/b (G) embryo at bud stage (10 hpf). Arrowheads demarcate body axis. (B, C, H, and I) Expression pattern of no tail (ntl), hatching gland gene 1(hgg1), and distal-less homeobox gene 3 (dlx3) marking the notochord, prechordal plate, and anterior neural plate, respectively, in a wild-type (B and C) and a MZfz7a/b (H and I) embryo at bud stage. Animal (B and H) and dorsal (C and I) views. (D?F and J?L) Frequency distribution of pairs of division-orientation angles (θ, φ) in wild-type (D?F) and MZfz7a/b (J?L) embryos during gastrulation (6?10 hpf). Chi-square test on the combined angles: wild-type versus MZfz7a/b (p < 0.05). (D and J) Distribution frequency of pairs of division-orientation angles in wild-type (D) and MZfz7a/b (J). (E and K) Distribution of azimuthal angles (θ) in wild-type (E) and MZfz7a/b (K). (F and L) Distribution of elevation angles (φ) in wild-type (F) and MZfz7a/b (L). (M) Schematic dorsal view of a zebrafish embryo at the early gastrula stage. The dotted line demarcates the shield. Pairs of daughter cells are shown as wired gray spheres. The reference coordinate system used to calculate the angles of the cell divisions is indicated by the red (antero-posterior), green (dorso-ventral), and blue (left-right) axes. (N) Picture of the dorsal side of a wild-type embryo at 60% epiboly. Two daughter cells resulting from one representative division are marked by red spheres. The same coordinate system as in (M) is used. The scale bar represents 40 μm. (O) Schematic diagram showing the azimuthal (θ) and the elevation (φ) angles for a single cell division represented by wired gray spheres and red nuclei. The embryonic axes are shown in respect to the reference system. See also Figures S1 and S2 and Table S1. |

Stereotypical Germ-Layer Progenitor Cell Division Orientation Is Not Required for Body-Axis Elongation during Gastrulation (A?D) Body-axis elongation (A) and ntl and hgg1 expression in wild-type (B), emi1 (C), and wild-type embryos treated with cell-division inhibitors (D) at bud stage (10 hpf). (E?H) Body-axis elongation (E) and ntl and hgg1 in wild-type (F), MZfz7a/b embryos treated with DMSO (G) and MZfz7a/b embryos treated with cell-division inhibitors (H) at bud stage (10 hpf). (I?K) Frequency distribution of pairs of division-orientation angles (θ,φ) in DynIC-Ab-injected embryos during gastrulation (6?10 hpf). Distribution of azimuthal (θ) (J) and elevation (φ) angles (K). Chi-square test on the combined angles: wild-type versus DynIC-Ab (p < 0.005). (L?N) Body-axis elongation (L) and ntl and hgg1 expression in wild-type (M) and DynIC-injected embryos (N) at bud stage (10 hpf). Error bars show the standard deviation. See also Figure S3 and Table S1. |

Stereotypical Neural Progenitor Cell Division Orientation Is Required for Neural Rod Midline Formation during Neurulation (A?F′) Micrographs of F-actin distribution in dorsal (A?F) and transversal (A′?F′) confocal sections of Rhodamine-Phalloidin-stained neural rods in wild-type (A and A2), wild-type treated with cell-division inhibitors (B and B′), MZfz7a/b mutants (C and C′), MZfz7a/b mutants treated with cell-division inhibitors (D and D′), DynIC-Ab-injected embryos (E and E′), and DynIC-Ab-injected embryos treated with cell-division inhibitors (F and F′) at the 16-somite-stage (15 hpf). OV= otic vesicle; dashed lines in (A?F) demarcate the place of the transversal sections in (A′?F′). Scale bars represent 20 μm. (G) Quantification of neural rod midline formation in wild-type embryos, wild-type embryos treated with cell-division inhibitors, emi1 embryos, MZfz7a/b mutants, MZfz7a/b mutants treated with cell-division inhibitors, DynIC-Ab-injected embryos, and DynIC-Ab-injected embryos treated with cell-division inhibitors. (H) Number of cell divisions in axial and paraxial regions of wild-type, MZfz7a/b, DynIC-Ab injected, and tri embryos during neurulation (13?16 hpf) (I) Schematic representations of the neural rod (transverse section), summarizing the effects on neural progenitor cell division localization and orientation and on neural rod midline formation in the different experimental conditions analyzed in this study. See also Table S1. |

Related to Figure 1. Fz7 functions downstream of Wnt11 in regulating convergence and extension movements and body axis elongation during gastrulation. |

Related to Figure 2.Stereotypical germ layer progenitor cell division orientation during gastrulation is mildly affected in embryos with defective convergence and extension movements, but intact Wnt/PCP signaling. |