
Fig. 3
- ID
- ZDB-IMAGE-260731-30
- Publication
- Li et al., 2026 - The accumulation of methylglyoxal and acrolein impairs arginine homeostasis causing hyperglycemia and renal abnormalities in male zebrafish
- All Figures
- Figures for Li et al., 2026
|
Fig. 3
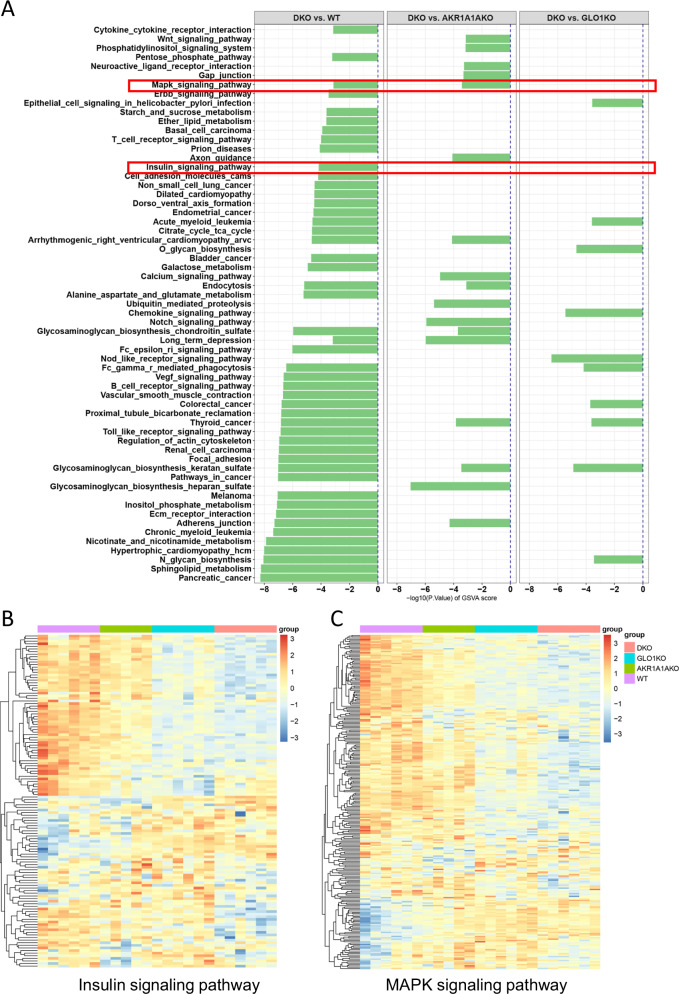
Downregulated insulin signaling pathway in GLO1/AKR1A1A DKO zebrafish compared to WT.
A GSVA of RNA-sequencing data revealed the significantly downregulated pathways in pairwise comparisons (DKO vs WT, DKO vs AKR1A1AKO, DKO vs GLO1KO) at 96hpf. n = 5/6 biological replicates per group. The red frame represents insulin signaling and its downstream pathway. GSVA enrichment scores were compared between groups using a two-sided empirical Bayes moderated t-test implemented in the limma package. Plotted values represent -log10 of the unadjusted two-sided P values. GSVA, Gene Set Variation Analysis; hpf, hours of post fertilization. B Heat map of relative mRNA expression in the insulin signaling pathway gene set. Orange indicates higher expression and blue indicates lower expression. C Heat map of relative mRNA expression in MAPK signaling pathway gene set. Orange indicates higher expression and blue indicates lower expression.