
Fig 1
- ID
- ZDB-IMAGE-260629-133
- Publication
- Docampo-Seara et al., 2026 - The microglia-derived protein sema4ab attenuates regenerative neurogenesis after spinal cord injury in zebrafish
- All Figures
- Figures for Docampo-Seara et al., 2026
|
Fig 1
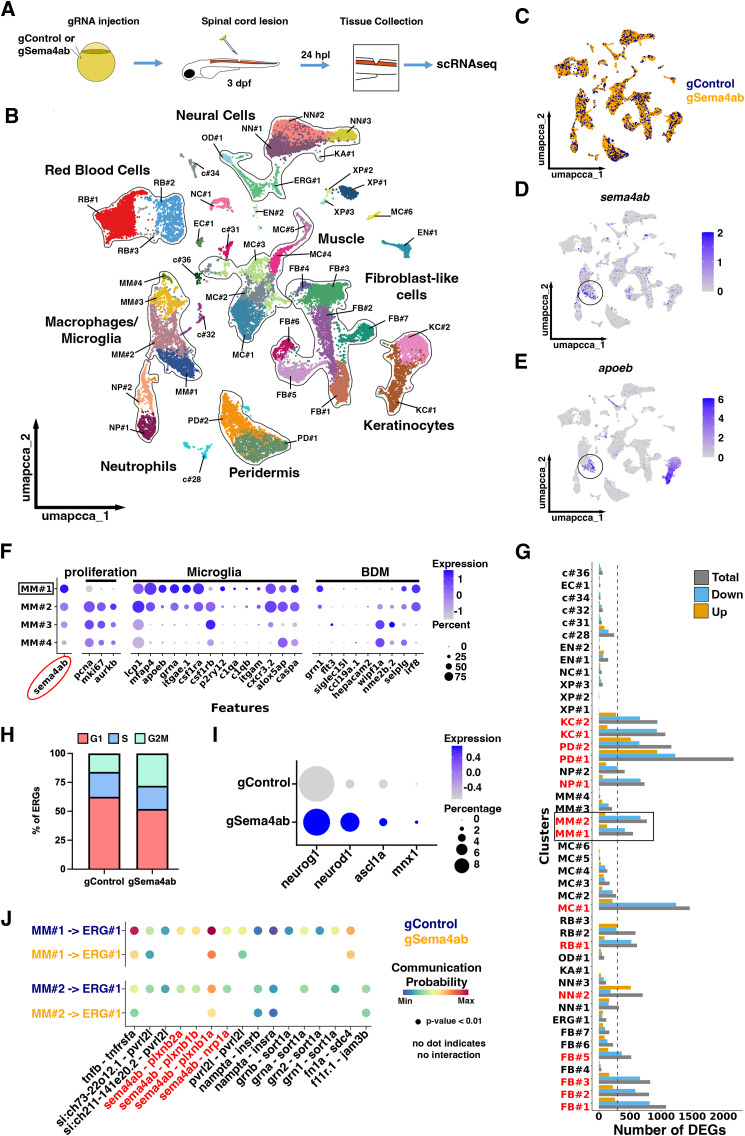
scRNA-seq indicates changes gene expression after sema4ab ablation and predicts changes in regenerative neurogenesis.
(A) A schematic of the experimental design for scRNA-seq in somatic mutants is shown. (B) Cluster analysis identifies 44 cell clusters that represent the main expected cell types in the injury site at 24 hpl. (C) A UMAP shows no major changes in cell type representation resulting from sema4ab disruption (gControl in blue, gSema4ab in yellow). (D,E) Feature plots for sema4ab (D) and apoeb (microglia; E) show overlap (black circles). (F) A dot plot of the four BDMs/microglia clusters showing that sema4ab-enriched clusters align with the expression of microglia marker genes. (G) A graph indicating differential expression of genes (DEG) between samples is shown. Cell clusters with major changes (>300 DEGs) are indicated in red. Microglia clusters MM#1 and MM#2 are boxed. (H) Graph shows the proportions of ERGs in each cell cycle phase in control gRNA-injected larvae and sema4ab gRNA-injected larvae. Note that the proportion of cells in M/G2 phase is increased in sema4ab somatic mutants (gControl: 16% vs gSema4ab: 28%). (I) Dot plot showing an increase in differentiation marker gene expression in ERG progenitors when sema4ab is disrupted. (J) Dot plot illustrating the communication probabilities of all ligand-receptor interactions identified between MM#1 and ERGs, as well as between MM#2 and ERGs. The absence of dots indicates that no interaction was detected. For a key to cluster abbreviations in B and G, see S5 Table.