
Figure 2
- ID
- ZDB-IMAGE-260623-11
- Genes
- Antibodies
- Publication
- Capecki et al., 2026 - Evidence that disruption of Discoidin domain receptor 2 contributes to palate malformations through effects on the extracellular matrix
- All Figures
- Figures for Capecki et al., 2026
|
Figure 2
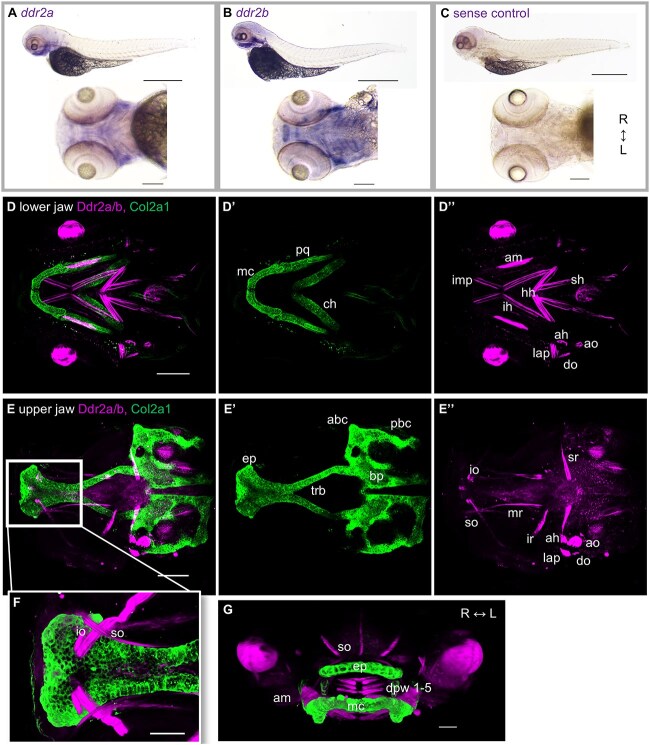
Analysis of ddr2a and ddr2b expression in wildtype zebrafish larvae (zfl). (A–C) RNA in situ hybridization at 3 days post fertilization (dpf). Lateral view of whole-mount zfl and dorsal view of the head (R, right; L, left). N = 3 independent experiments per group. Scale bars: Whole-mount zfl, 500 μm; head images, 100 μm. (C) sense control: ddr2a negative control. No expression was detected in negative control samples. (D–G) Immunofluorescence analysis of 4 dpf zfl with anti-DDR2 (expected to target all DDR2-orthologs) and anti-Collagen2a1. Visible cartilages are: Mc, Meckel’s; pq, palatoquadrate; ch, ceratohyal; ep, ethmoid plate; trb, trabeculae; abc/pbc, anterior and posterior basicranial commissures; bp, basal plate. Visible muscles are: Imp, intermandibularis posterior; am, adductor mandibulae; ih, interhyals; hh, hyohyals; sh, sternohyoideus; lap, levator arcus palatini; ah, adductor hyoideus; ao, adductor operculi; do, dilator operculi; io/so, inferior/superior oblique; mr/ir/sr, medial/inferior/superior rectus; dpw, dorsal pharyngeal wall. (D) dorsal view of the zfl lower jaw. A stranded pattern of DDR2-ortholog expression is visible, corresponding to the developing muscle structures of the lower jaw (D”). Scale bar, 100 μm. (E) dorsal view of the zfl upper jaw, including the ethmoid plate. In this plain, stranded staining of DDR2-orthologs is also visible (E”). Scale bar, 100 μm. (F) high-magnification oral view of the ethmoid plate region; muscle strands close to the ethmoid plate, corresponding to the inferior and superior oblique muscles, express DDR2-orthologs. A distinct signal in the posterior portion of the ethmoid plate is also visible. Scale bar, 50 μm. (G) frontal view of the zfl upper and lower jaw (R, right; L, left). Scale bar, 100 μm.