
Fig. 5
- ID
- ZDB-IMAGE-260617-11
- Genes
- Antibodies
- Publication
- Martin et al., 2026 - Nr2f1a and Isl1 repress acquisition of epicardial identity in venous atrial cardiomyocytes
- All Figures
- Figures for Martin et al., 2026
|
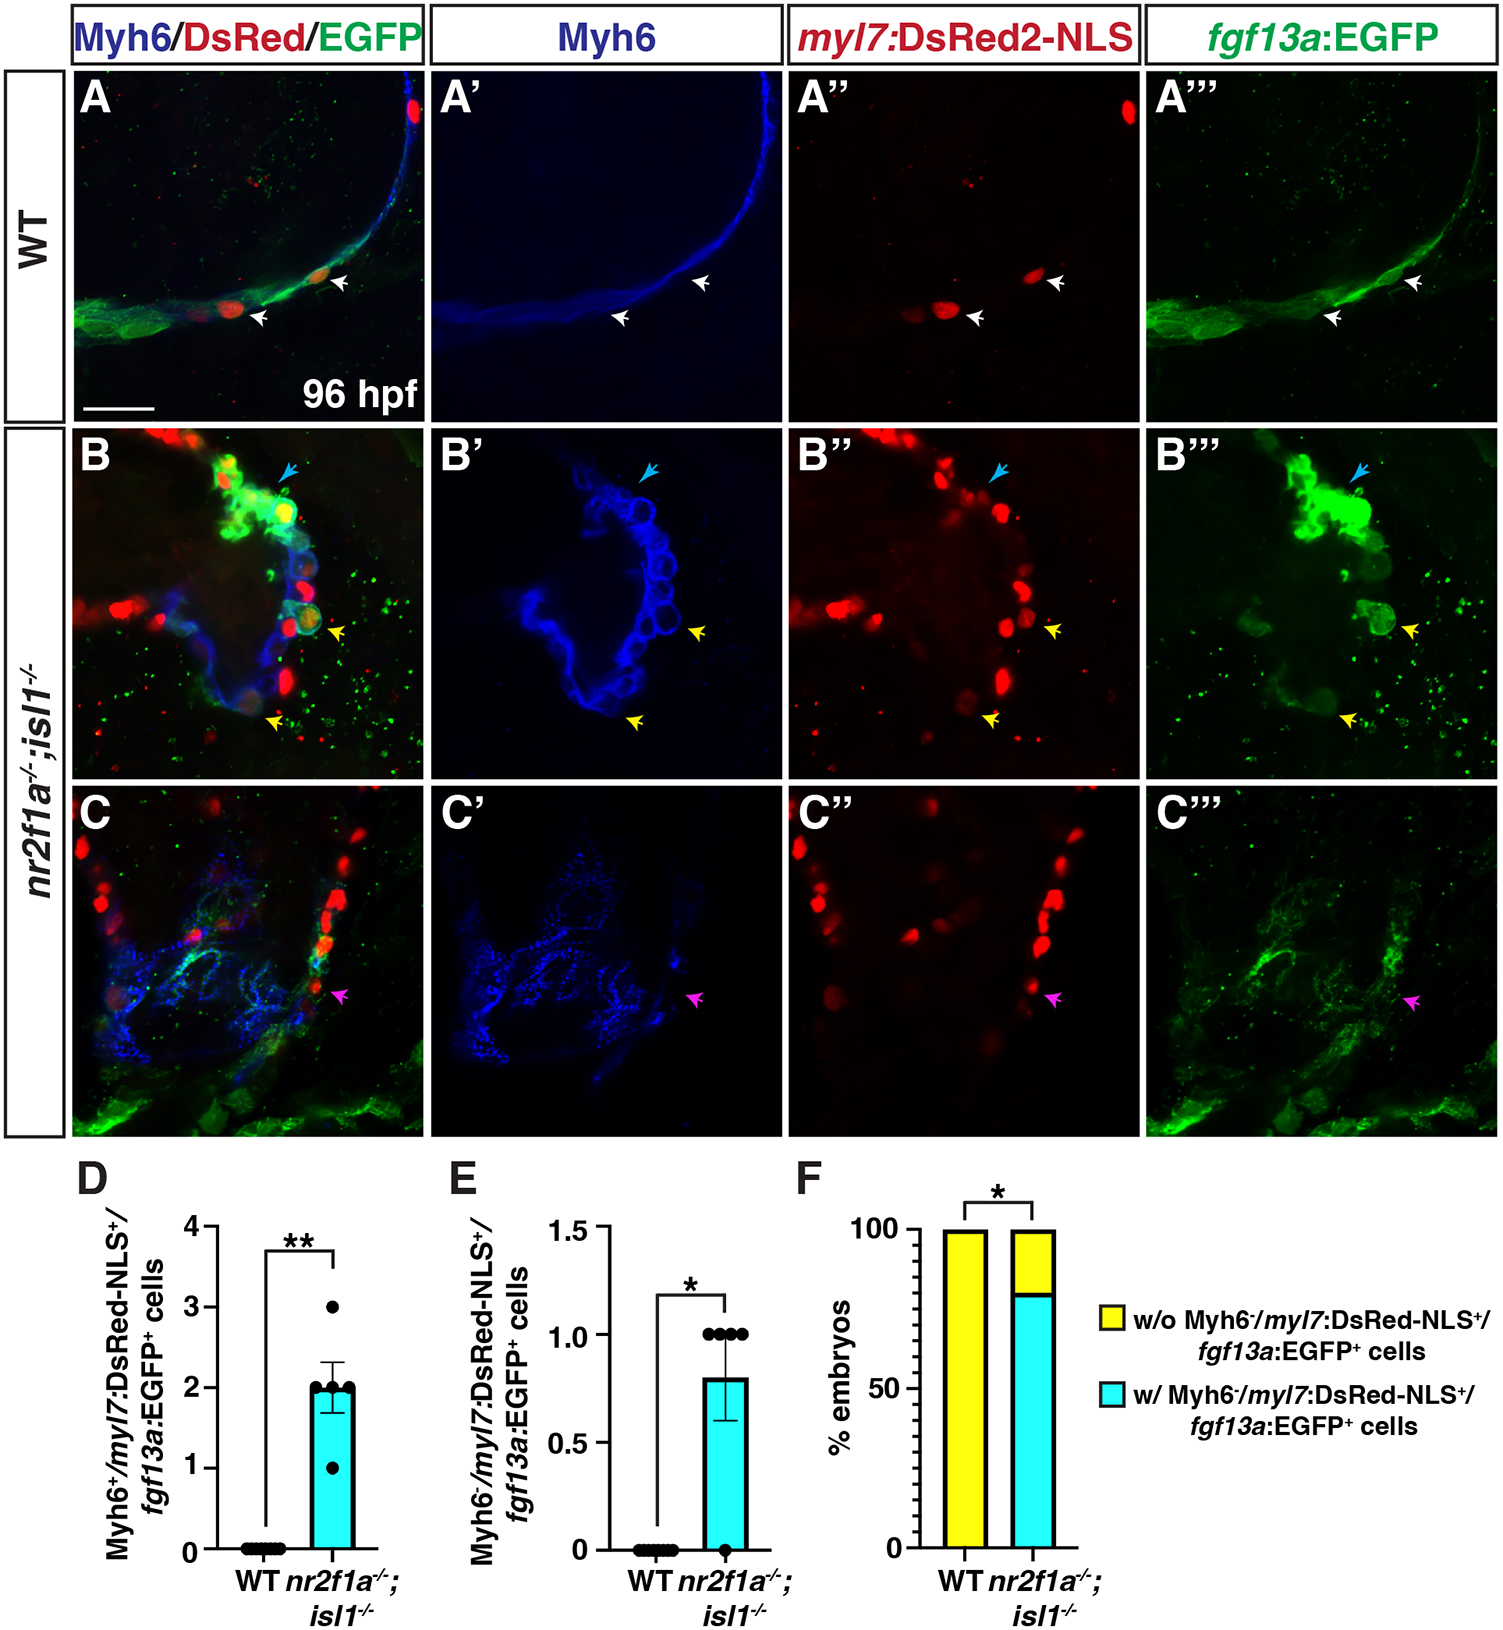
Fig. 5 Co-expression of cardiomyocyte markers with fgf13a:EGFP in nr2f1a;isl1 mutant hearts. (A-C‴) Optical sections of the venous pole of wild-type and nr2f1a−/−;isl1−/− hearts at 96 hpf stained for Myh6 (blue), myl7:DsRed2-NLS (red) and fgf13a:EGFP (green). (A-A‴) Myh6+/myl7:DsRed2-NLS+/fgf13a:EGFP+ cells (pacemaker cardiomyocytes) in wild-type heart (white arrows). (B-B‴) Individual Myh6+/myl7:DsRed2-NLS+/fgf13a:EGFP+ cells in nr2f1a−/−;isl1−/− heart (yellow arrows). (B-B‴) Myh6,sup>+/myl7:DsRed2-NLS+/fgf13a:EGFP+ AV node cardiomyocytes in nr2f1a−/−;isl1−/− heart (blue arrows). (C-C‴) Myh6−/myl7:DsRed2-NLS+/fgf13a:EGFP+ cells in nr2f1a−/−;isl1−/− heart (magenta arrows). Wild type (n=8) and nr2f1a−/−;isl1−/− (n=5). Scale bar: 10 μm. (D,E) Quantification of distinct Myh6+/myl7:DsRed2-NLS+/fgf13a:EGFP+ and Myh6−/myl7:DsRed2-NLS+/fgf13a:EGFP+ cells in wild-type and nr2f1a−/−;isl1−/− embryos. (D) *P=0.0032; (E) **P=0.0161 (two-tailed Welch's t-test). (F) Proportion of embryos with at least one Myh6−/myl7:DsRed2-NLS+/fgf13a:EGFP+ cell. *P=0.007 (Fisher's exact test).