IMAGE

Fig. 5

ID
ZDB-IMAGE-260607-5
Publication
Perey-Simon et al., 2025 - dUTPase is essential in zebrafish development and possesses several single-nucleotide variants with pronounced structural and functional consequences
All Figures
Figures for Perey-Simon et al., 2025
Image
Figure Caption

Fig. 5

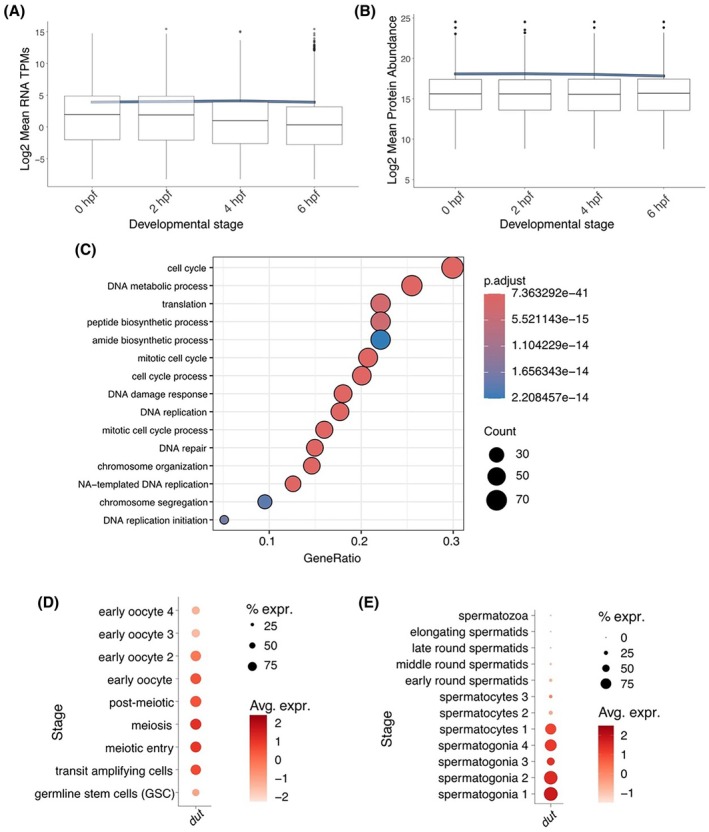
In silico analysis of dut expression during zebrafish embryogenesis and germ cell development. (A, B) Expression levels of dut transcripts and dUTPase protein shown as boxplot reflecting the median, interquartile range (IQR), and whiskers representing 1.5 × IQR compared to normalized means (blue) around the MTZ (3 hpf). Graph is created by Shiny script described in ref [63]. (TPM stands for “Transcripts per million”; protein abundance reflects normalized values of mass spectrometry measurements of three (Panel A) or four (Panel B) biological replicates; all data from: [63]). (C) GO analysis of genes that are significantly coexpressed with dut from 4 hpf to 120 hpf. (Based on data from: [64]). GeneRatio represents the proportion of genes that are coexpressed with dut and are annotated to a specific GO term, whereas Count represents the raw number of genes annotated to the GO term. The p.adjust value reflects the adjusted p value for the enrichment, using the Benjamini–Hochberg adjustment method. (D, E) Expression of dut during various stages of oogenesis (D) and spermatogenesis (E). (Based on data from: [67, 68].) The percentage of cells in the dataset expressing the gene (% expr) is shown, as is the average expression level (Avg. expr.) of the gene across all the cells in a given subgroup, calculated based on the normalized expression of the genes in the dataset.

Acknowledgments
This image is the copyrighted work of the attributed author or publisher, and ZFIN has permission only to display this image to its users. Additional permissions should be obtained from the applicable author or publisher of the image. Full text @ FEBS Open Bio