
FIGURE 1
- ID
- ZDB-IMAGE-260514-35
- Antibodies
- Publication
- Aresi et al., 2026 - Establishing a Zebrafish Functional Assay to Assess the Pathogenicity of Variants of Uncertain Significance in Ciliopathies
- All Figures
- Figures for Aresi et al., 2026
|
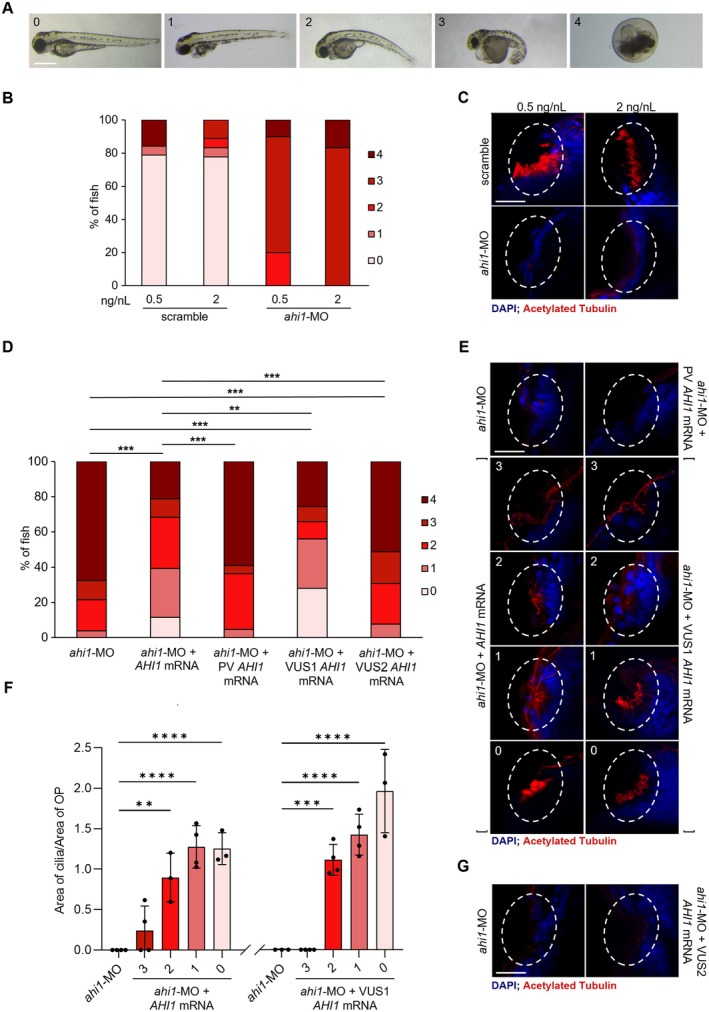
FIGURE 1 Establishing a morpholino‐based mRNA rescue platform to functionally classify ciliopathy VUSs in vivo. (A) Representative images of 3 dpf morphant severity categories (from 0 = normal to 4 = lethal), acquired by stereo microscopy at a 4× magnification. Scalebar: 500 μm. (B) Distribution of severity categories of ahi1 morphants injected with two different MO concentrations (0.5 and 2 ng/nL). A scramble oligonucleotide was used as control using both selected doses. (C) Representative images of cilia area in olfactory placode (OP, dashed line) in morphants injected with scramble (n ≥ 3) and ahi1‐MO (n ≥ 4). Scalebar: 25 μm. (D) Distribution of severity categories of morphants injected with ahi1‐MO 0.5 ng/nL alone or co‐injected with ahi1‐MO and, respectively, 100 pg AHI1 WT human mRNA, 100 pg AHI1 pathogenic variant (PV), 100 pg AHI1 VUS1 and 50 pg AHI1 VUS2. (E) Representative cilia images for each category from severe (3) to normal (0) and (F) quantitation of cilia area in OP (dashed line) in morphants injected with ahi1‐MO alone (n = 10) or with ahi1‐MO and, respectively, 100 pg AHI1 WT human mRNA (n = 14), 100 pg AHI1 PV (n = 8), 100 pg AHI1 VUS1 (n = 15). Scalebar: 25 μm. (G) Representative images of cilia area in OP (dashed line) in morphants injected with ahi1‐MO alone (n = 3) or co‐injected with ahi1‐MO and 50 pg AHI1 VUS2 (n = 3). Scalebar: 25 μm. All the immunofluorescence images were acquired by confocal microscopy using water objective, magnification 25×, zoom 3×. Nuclei are stained with DAPI (in blue), cilia are stained by anti‐acetylated Tubulin (in red) (**p ≤ 0.01, ***p ≤ 0.001, ****p ≤ 0.0001).