
Figure 6.
- ID
- ZDB-IMAGE-260427-57
- Publication
- Gao et al., 2026 - PCYT1A Hypophosphorylation Underlies Retinal Lipid Dysregulation in CERKL Retinitis Pigmentosa and Is Therapeutically Reversed by Phosphatidylcholine
- All Figures
- Figures for Gao et al., 2026
|
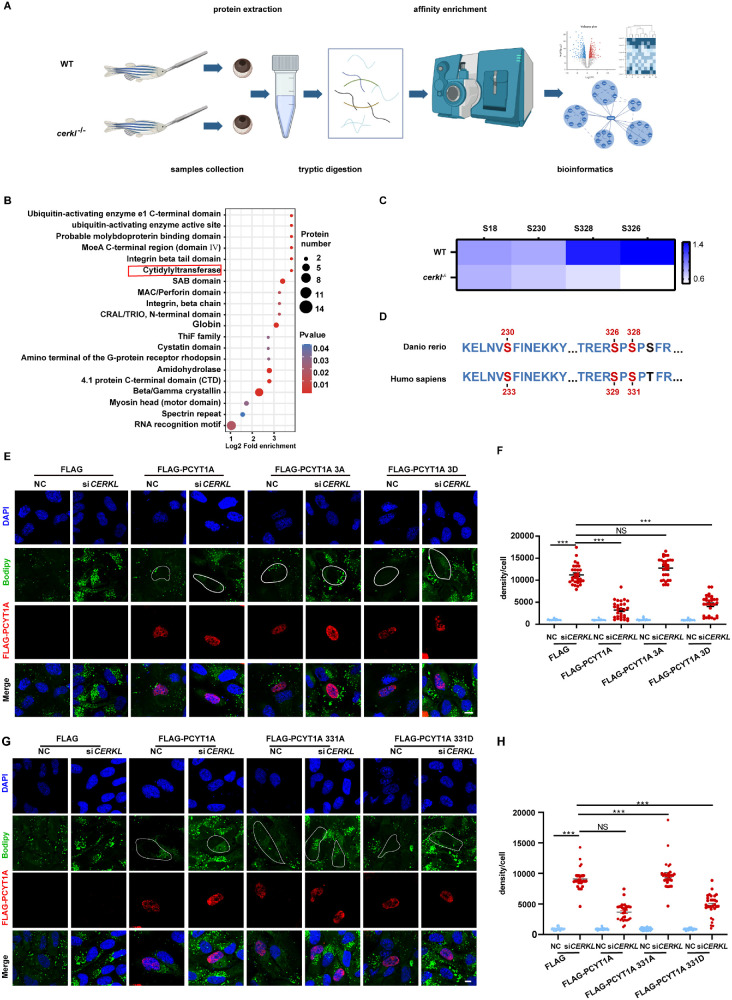
Figure 6.
Depletion of CERKL decreased serine phosphorylation of PCYT1A. (