
|
Fig. 5
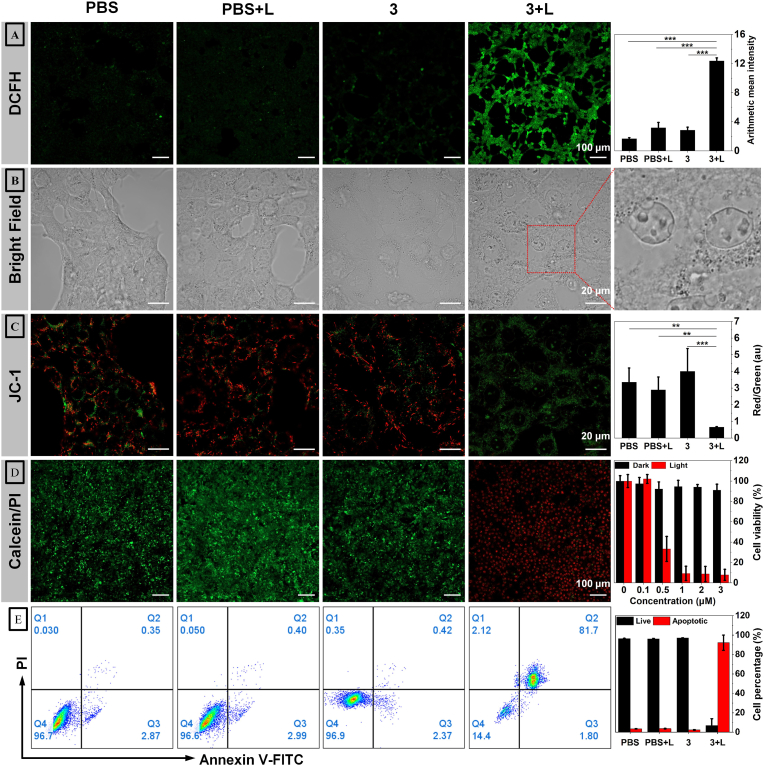
(A) ROS generation capability in 4T1 cells under different treatment conditions (n = 3). (B) Cell morphology changes in 4T1 cells under different treatment conditions. (C) Mitochondrial membrane potential in 4T1 cells under different treatment conditions (n = 3). (D) live/dead cell staining and CCK-8 (n = 6) of 4T1 cells after various treatments. Scale bar = 20 μm. (E) Apoptosis of 4T1 cells after flow cytometry analyzed different treatments (n = 3). Quadrants were defined as follows: Q1 (Annexin V−/PI+, necrotic cells), Q2 (Annexin V+/PI+, late apoptotic/necrotic cells), Q3 (Annexin V+/PI−, early apoptotic cells), and Q4 (Annexin V−/PI−, viable cells). A minimum of 1 × 10⁴ single-cell events were acquired per sample for quantitative analysis.