
Fig. 6
- ID
- ZDB-IMAGE-260408-6
- Publication
- Hernandez Herrera et al., 2026 - ercc6 deficient zebrafish exhibit UV and metronidazole sensitivity, increased oxygen consumption, and impaired hair cell mechanoelectrical transduction which can be restored by the superoxide dismutase mimetic MnTBAP
- All Figures
- Figures for Hernandez Herrera et al., 2026
|
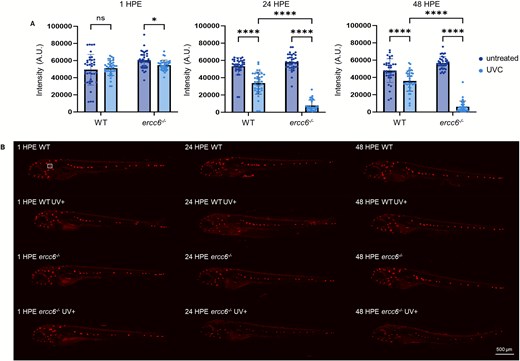
Fig. 6 Mechanoelectrical transduction function in ercc6−/− larvae. (A) Relative FM1–43 uptake in the MI1 lateral line neuromast following UVC exposure, as indicated by fluorescence intensity, in 1-, 24-, and 48-h post exposure (HPE) larvae. (B) Representative images of zebrafish lateral line fluorescence intensity following FM1–43 uptake (MI1 neuromast indicated with white box for clarity in B top left panel). Data is from 5 replicate experiments with a total of 34–38 larvae per group and is represented by mean ± SD. Each data point represents a single zebrafish larva. Differences between groups were analyzed via two-way ANOVA with multiple comparisons (*P-value<0.05; ****P-value<0.0001). Scale bar: 500 μm.