
Fig. 5
- ID
- ZDB-IMAGE-260408-5
- Publication
- Hernandez Herrera et al., 2026 - ercc6 deficient zebrafish exhibit UV and metronidazole sensitivity, increased oxygen consumption, and impaired hair cell mechanoelectrical transduction which can be restored by the superoxide dismutase mimetic MnTBAP
- All Figures
- Figures for Hernandez Herrera et al., 2026
|
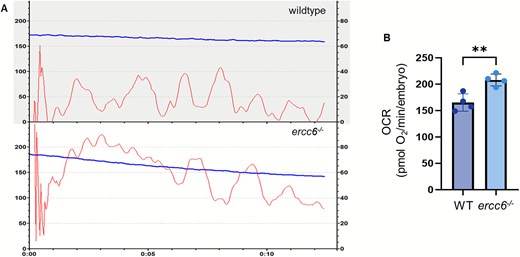
Fig. 5 Oxygen consumption rates of ercc6−/− larvae. (A) Representative readout of oxygen levels in measurement chambers using an Oroboros Oxygraph 2 K. Blue line shows concentration of oxygen in chambers (nmol O2/ml), red line shows rate of change of oxygen concentration (pmol O2/s*ml). (B) Basal oxygen consumption rates of 5-days post fertilization larvae. Data is from 4 replicate experiments with 60 embryos per group, per experiment and is represented by mean ± SD. Each data point represents OCR averaged from 60 pooled larvae. Statistical analysis between these two groups was conducted via an independent t-test (**P-value = 0.0052).