
IMAGE
Fig. 3
- ID
- ZDB-IMAGE-260408-3
- Genes
- Publication
- Hernandez Herrera et al., 2026 - ercc6 deficient zebrafish exhibit UV and metronidazole sensitivity, increased oxygen consumption, and impaired hair cell mechanoelectrical transduction which can be restored by the superoxide dismutase mimetic MnTBAP
- All Figures
- Figures for Hernandez Herrera et al., 2026
Image
|
Figure Caption
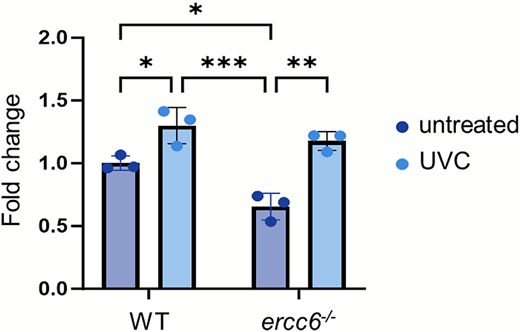
Fig. 3 UVC effects on ercc6 expression. Graph showing the fold-change in ercc6 expression for control wildtypes, control ercc6−/−, UVC treated wildtypes, UVC treated ercc6−/−. Data is from 3 replicate experiments, with 3 technical replicates per group, per experiment and is represented by mean ± SD. Each data point represents the average of technical replicates. Differences between groups were evaluated via two-way ANOVA with multiple comparisons (*P-value<0.05; **P-value<0.01; ***P-value<0.001).
Figure Data
Acknowledgments
This image is the copyrighted work of the attributed author or publisher, and
ZFIN has permission only to display this image to its users.
Additional permissions should be obtained from the applicable author or publisher of the image.
Full text @ Hum. Mol. Genet.