IMAGE

Figure 1

ID
ZDB-IMAGE-260330-71
Source
Figures for Carneiro et al., 2026
Image
Figure Caption

Figure 1

Morphological assessment of zebrafish larvae during the experimental period. (
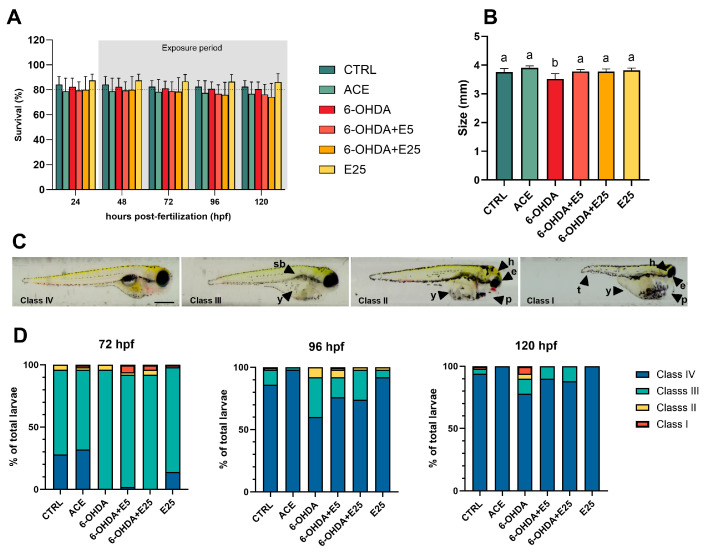
A) Cumulative mortality recorded throughout the exposure period. Data are presented as mean ± SD from five independent replicates. No statistically significant differences were observed between treatment groups. (B) Larval body length measurements. Values represent mean ± SD from five independent replicates (10 larvae per treatment per replicate, n = 1). Different letters indicate statistical differences among treatments (p < 0.05). (C) Representative images illustrating the morphological classes assigned based on treatment-induced alterations. Scale bar = 500 μm. sb: swimbladder; y: yolk sac; h: head; e: eye; p: pericardium; t: tail. (D) Distribution of larvae across morphological classes at 72, 96, and 120 hpf for each treatment group. Data are expressed as mean percentages (n = 5, with 10 larvae evaluated per replicate). CTRL (E3 medium), ACE (0.05% acetone), 6-OHDA (250 µM), 6-OHDA+E5 (250 µM 6-OHDA + 5 µg/mL extract), 6-OHDA+E25 (250 µM 6-OHDA + 25 µg/mL extract), and E25 (25 µg/mL extract).

Acknowledgments
This image is the copyrighted work of the attributed author or publisher, and ZFIN has permission only to display this image to its users. Additional permissions should be obtained from the applicable author or publisher of the image. Full text @ Int. J. Mol. Sci.