
|
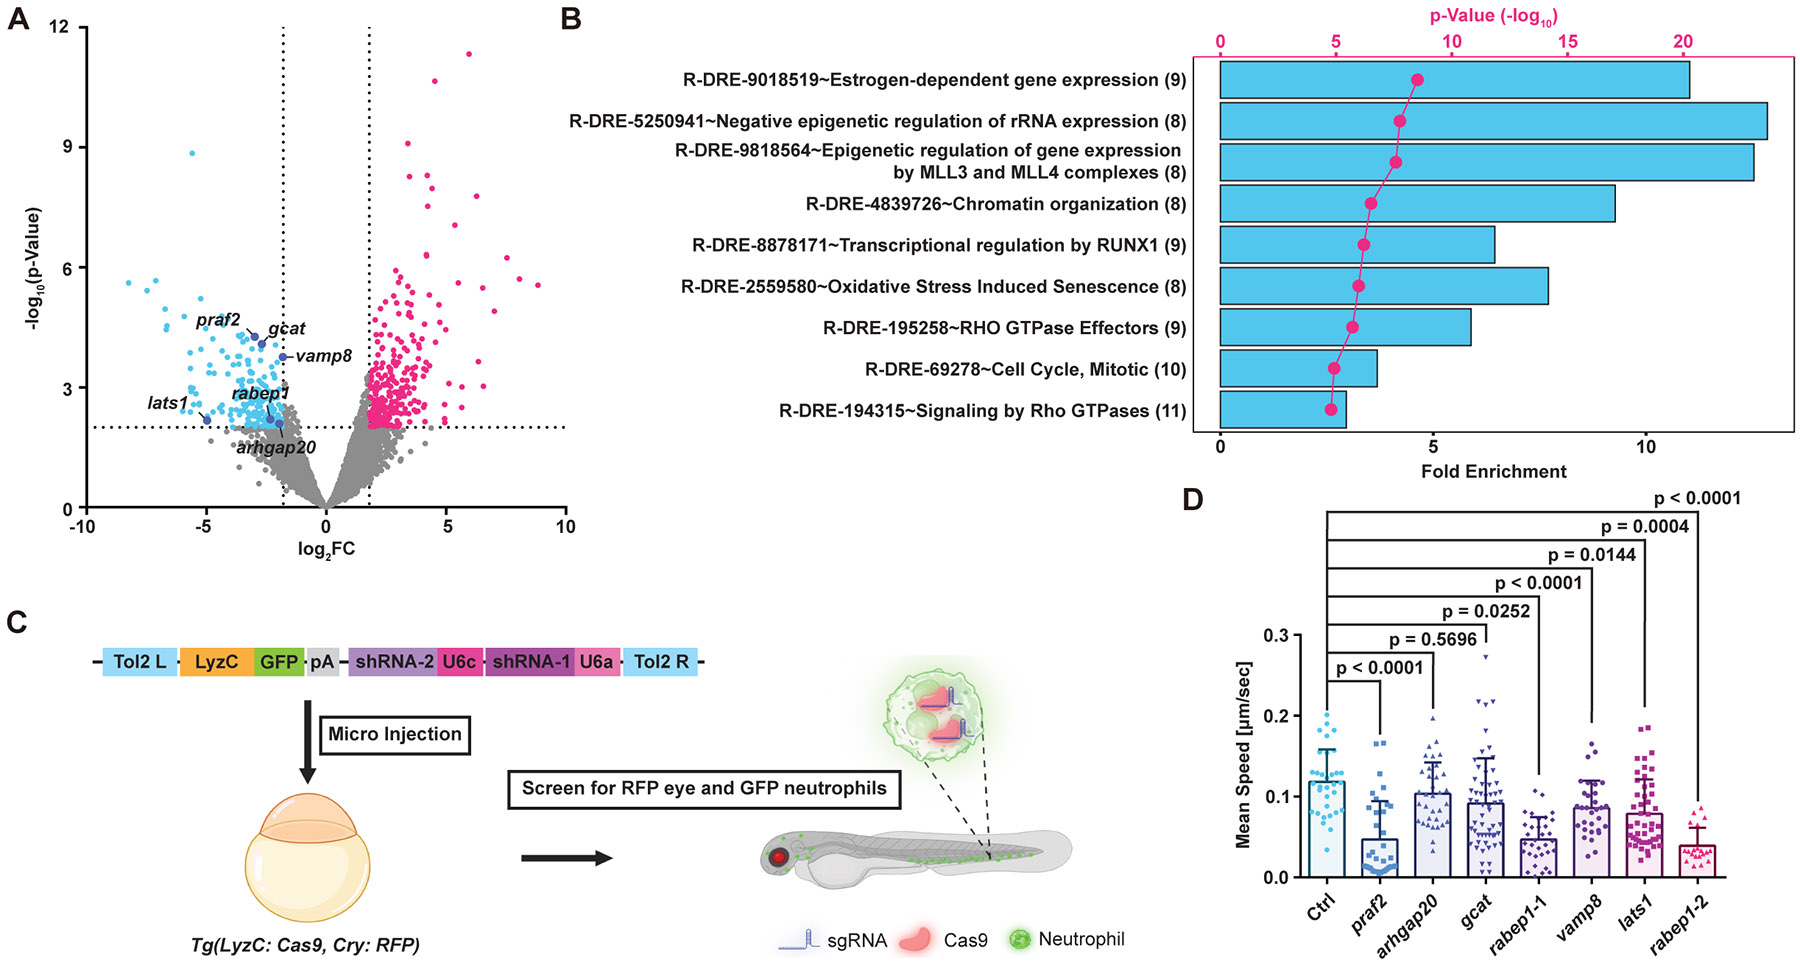
Fig. 2 miR-190 overexpression significantly reduces rabep1 expression in neutrophils.(A) Volcano plot showing differentially expressed genes (DEGs) in miR-190 overexpressing (OE) neutrophils compared to vector controls. Down-regulated DEGs are depicted in cyan, and up-regulated DEGs in pink. Selected down-regulated DEGs based on screening criteria are highlighted in the plot. (B) GO enrichment analysis of significantly downregulated DEGs in miR-190-OE neutrophils. (C) Schematic of transient sgRNA-expressing plasmid injection into Cas9-expressing embryos to generate transient TSKO. sgRNA-expressing plasmids were designed to produce two separate sgRNAs targeting one specific gene at two different loci. (D) Quantification of neutrophil motility in transient TSKO screen. The assay included 3 biological repeats, each tracking 20-58 neutrophils from 5-8 fish per group. Data are presented as mean ± SD and analyzed using Dunnett's multiple comparisons test.