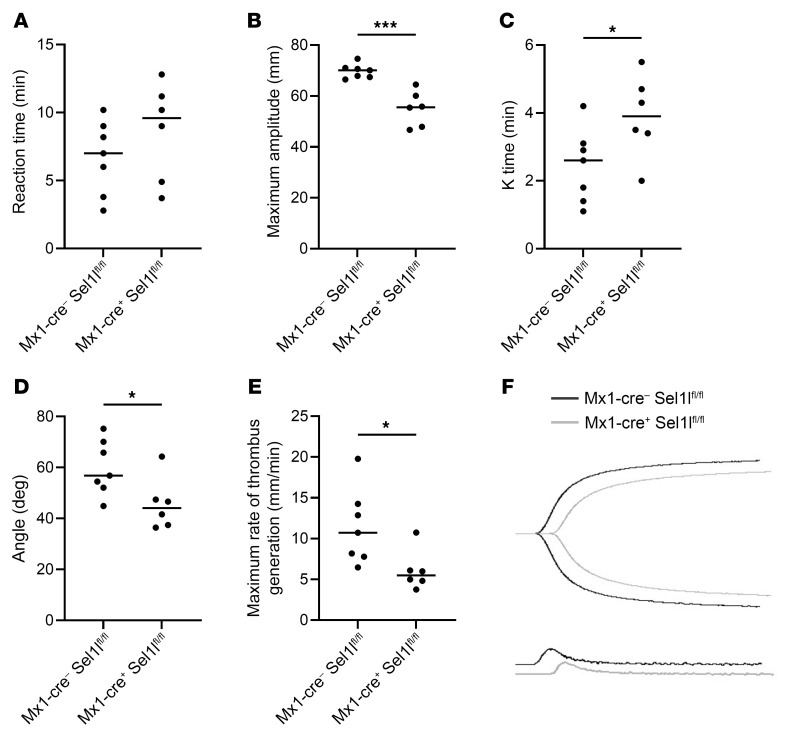
IMAGE

Figure 7

ID
ZDB-IMAGE-260218-7
Source
Figures for Dahlgren et al., 2026
Image
Figure Caption

Figure 7 Altered TEG in Sel1l mutant mice.

TEG was performed on control Mx1-creSel1lfl/fl (n = 7) and knockdown Mx1-cre+ Sel1lfl/fl (n = 6) mice. The results showed (A) no significant difference in reaction time, (B) a significant decrease in maximum amplitude, (C) a significant increase in the time for the clot to reach a strength of 20 mm (K time), (D) a significant decrease in the rate of clot formation (α-angle), and (E) a significant decrease in maximal rate of thrombus generation. (F) Representative tracings and velocity curves show the difference between the control in black and the KO in gray. *P < 0.05 and ***P < 0.001 by 2-tailed Student’s t test.

Acknowledgments
This image is the copyrighted work of the attributed author or publisher, and ZFIN has permission only to display this image to its users. Additional permissions should be obtained from the applicable author or publisher of the image. Full text @ Journal of Clin. Invest.