
Image
|
Figure Caption
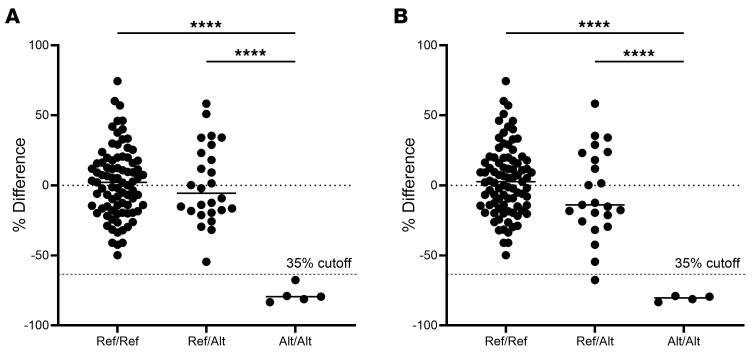
Figure 2 Genotypes of the larger population of phenotyped horses.
Genotypes of the larger population of 114 phenotyped TBs for (
Acknowledgments
This image is the copyrighted work of the attributed author or publisher, and
ZFIN has permission only to display this image to its users.
Additional permissions should be obtained from the applicable author or publisher of the image.
Full text @ Journal of Clin. Invest.