
Fig. 2
- ID
- ZDB-IMAGE-260215-172
- Publication
- Chen et al., 2026 - GJB2 c.109G > A mutation activating IFI27-mediated mitochondrial apoptosis pathway leading to hereditary non-syndromic hearing loss
- All Figures
- Figures for Chen et al., 2026
|
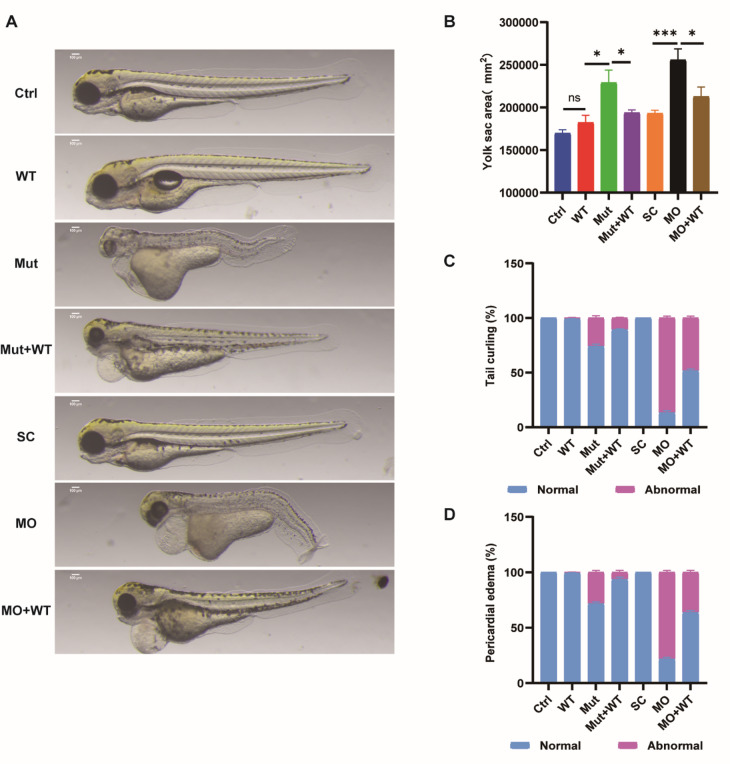
Fig. 2
Analysis of developmental phenotype changes in zebrafish after