
Fig. 7
- ID
- ZDB-IMAGE-260203-13
- Genes
- Publication
- Herget et al., 2025 - Pth4 neurons define a novel hypothalamic circuit that promotes sleep via brainstem monoaminergic neurons
- All Figures
- Figures for Herget et al., 2025
|
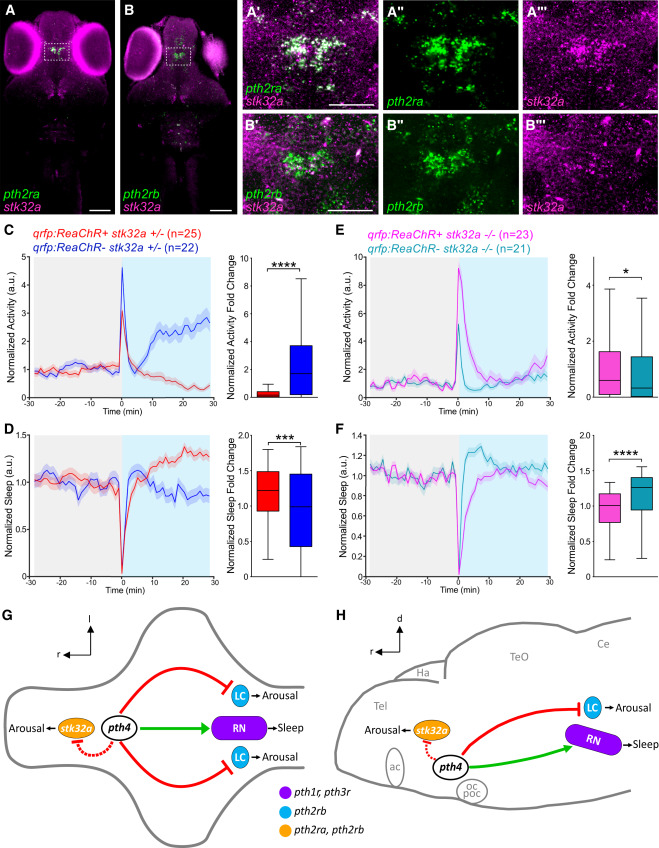
Fig. 7 Sleep induced by optogenetic stimulation of Pth4 neurons is suppressed in stk32a mutant fish (A–B″) HCR shows that pth2ra (A–A‴) and pth2rb (B–B‴) are both co-expressed with stk32a in the prethalamus. Boxed regions in (A) and (B) are magnified in (A′)–(A‴) and (B′)–(B‴). Scale bars, 100 μm (A and B); 50 μm (A′ and B′). (C–F) Optogenetic stimulation of Pth4 neurons suppresses locomotor activity and increases sleep in stk32a+/− fish (C and D) but not in stk32a−/− fish (E and F) compared with ReaChR-negative fish. Mean ± SEM line plots and Tukey boxplots are shown. n = number of fish. ∗p < 0.05, ∗∗∗p < 0.001, ∗∗∗∗p < 0.0001 by Mann-Whitney U test. (G and H) Model for sleep regulation by Pth4 neurons. Pth4 neurons in the hypothalamus promote sleep by activating the sleep-promoting 5HT SR and inhibiting the arousal-promoting LC in the hindbrain. Pth4 neurons also functionally interact with stk32a, possibly by inhibiting prethalamic neurons that express stk32a and/or via other stk32a-expressing cells. Colors indicate expression of specific pth receptors. Green arrows indicate activation. Red lines indicate inhibition. Dashed red lines indicate potential inhibition. Dorsal (G) and lateral (H) views are shown. Gray lines show the outline of the brain and anatomical landmarks. ac, anterior commissure; Ce, cerebellum; Ha, habenula; LC, locus coeruleus; oc, optic chiasm; poc, postoptic commissure; RN, raphe nuclei; Tel, telencephalon; TeO, optic tectum; l, lateral; d, dorsal; r, rostral. See also Figures S2 and S6.