
Fig. 2
- ID
- ZDB-IMAGE-251229-12
- Genes
- Antibodies
- Publication
- Kumar et al., 2025 - Temporal Dynamics of c-Fos Expression in a Zebrafish Larva Model of Pentylenetetrazole-Induced Seizures
- All Figures
- Figures for Kumar et al., 2025
|
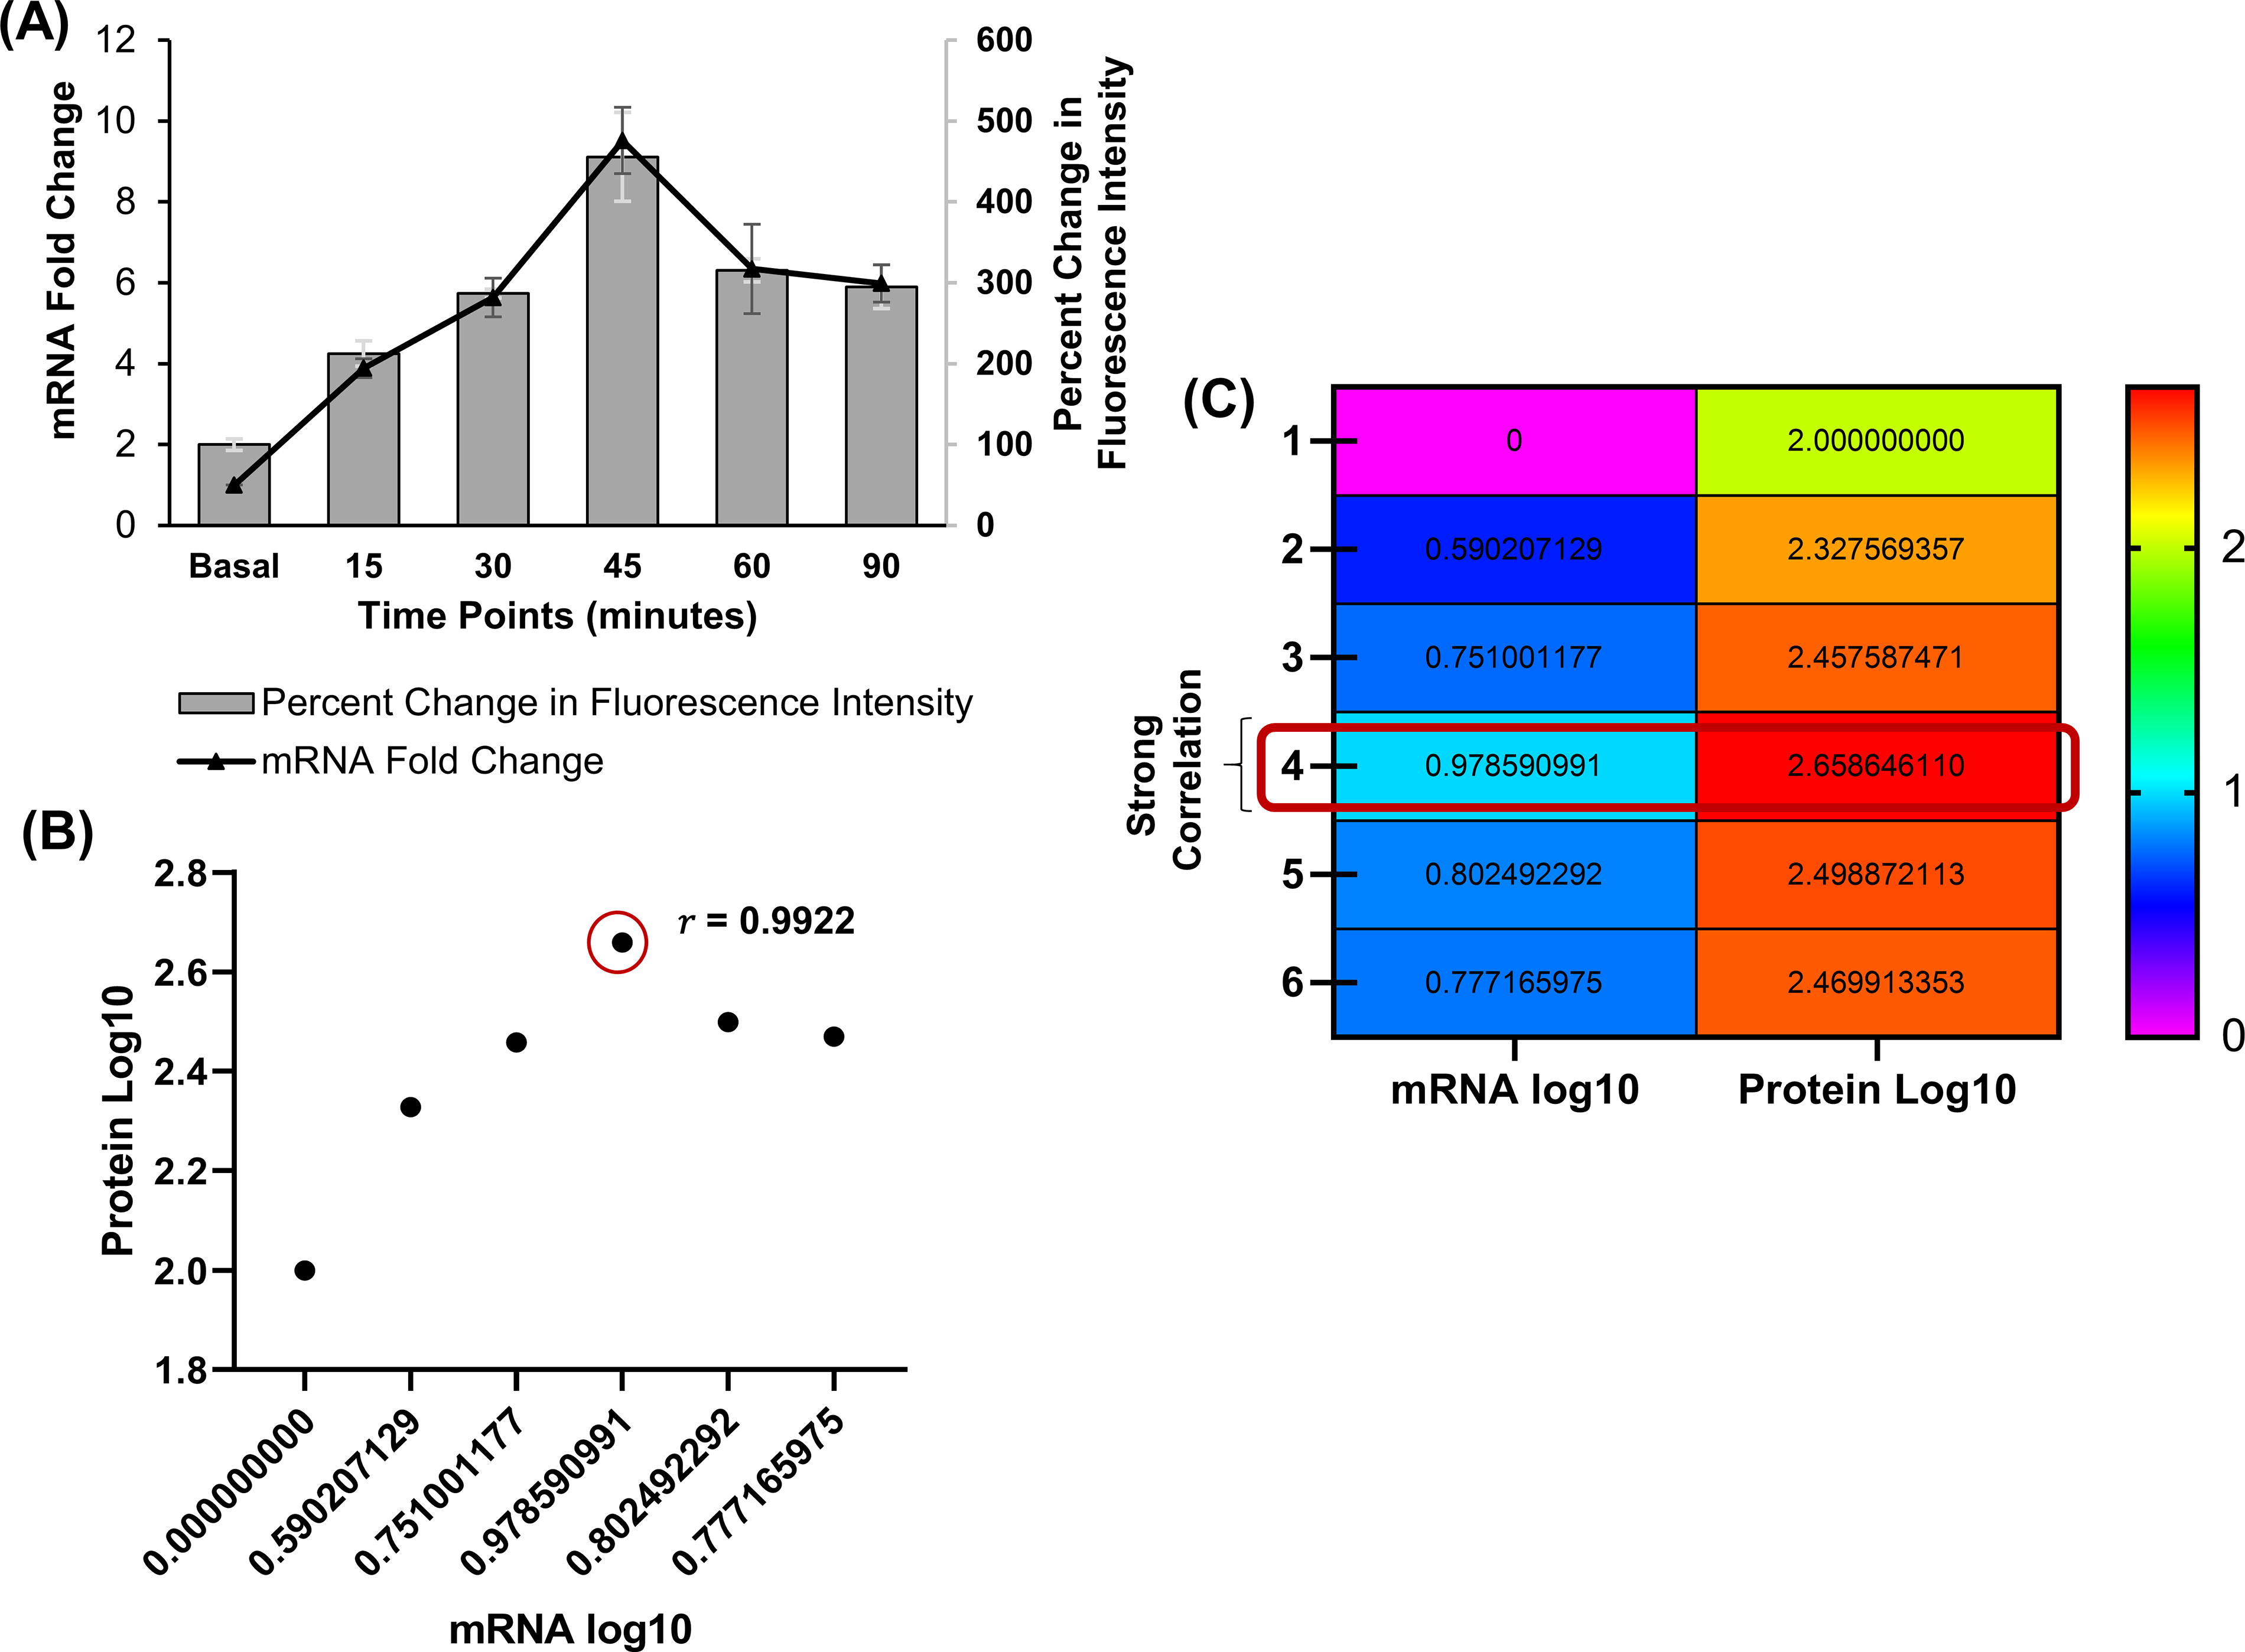
Fig. 2 Dual-axis graph showing the temporal dynamics of c-fos gene and c-Fos protein expression at different time points post the PTZ stimulus. The X-axis represents time points (0, 15, 30, 45, 60, and 90 min) post-stimulus. The left Y-axis displays the fold change in c-fos mRNA expression over g-naïve, and the right Y-axis represents the percent change in the fluorescence intensity of c-Fos protein over p-naive. The data were expressed as mean ± standard error of the mean (SEM). Basal: represents the baseline values of c-fos mRNA fold change and the percent change in the fluorescence intensity of c-Fos protein in the g-naïve and p-naïve groups, respectively (A). The Pearson correlation analysis represents the relationship between the log10 of c-fos mRNA fold change (X-axis) and the log10 of c-Fos protein expression (Y-axis) across 0, 15, 30, 45, 60, and 90 min post-PTZ stimulus. A strong positive correlation (r = 0.9922) at mRNA log10 = 0.9785 and protein log10 = 2.6586 indicates that approximately 96.92% of the variation in c-Fos protein expression is explained by the corresponding mRNA expression levels. The correlation is statistically significant (p < 0.05). 0 represents the log(10) of c-fos mRNA fold change in g-naïve group; 2 represents the log(10) of 100, the basal value of c-Fos protein from the p-naïve group (B). Heat map represents the Pearson correlation coefficients between c-fos mRNA expression (log10 fold change) and c-Fos protein expression (log10 percent change in the fluorescence intensity) across time points (0, 15, 30, 45, 60, and 90 min) post-PTZ stimulus. The color intensity at point 4 of the heat map scale indicates the strength of the correlation, with higher values reflecting stronger positive relationships (C). The analysis reveals a significant and strong correlation. 0 represents the log(10) of c-fos mRNA fold change in g-naïve group: 2 represents the log(10) of 100, the basal value of c-Fos protein from the p-naïve group.