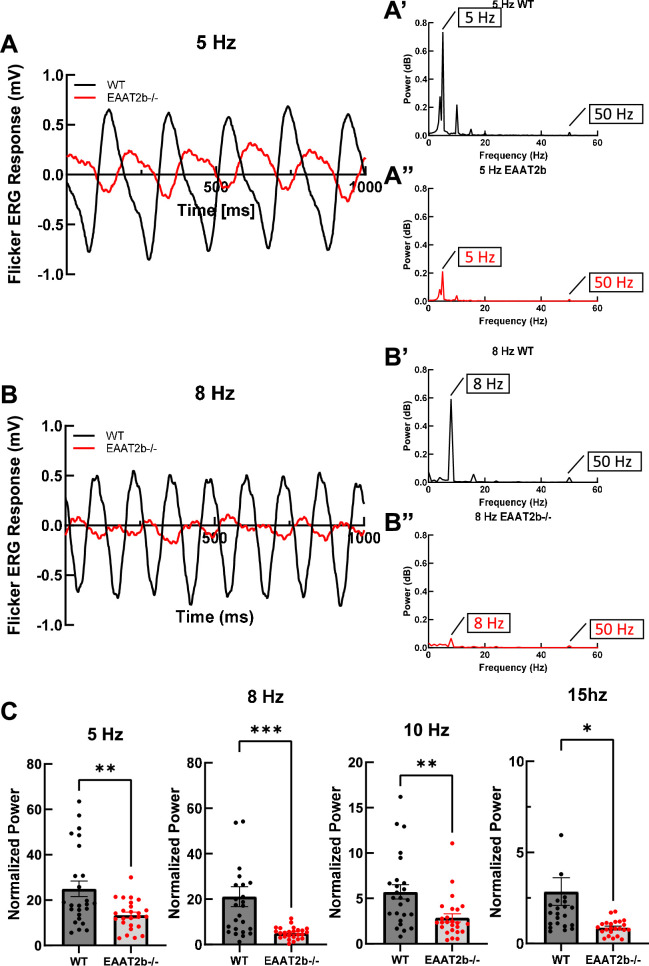
Temporal resolution of flicker ERG responses is reduced in eaat2b mutant fish. (A) Representative flicker ERG responses to a 5 Hz stimulus in WT controls (black) and eaat2b−/− larvae (red). Corresponding FFT power plots for WT (A′) and eaat2b−/− (A″) were generated in MATLAB from the traces shown in (A). (B) Representative flicker ERG responses to an 8 Hz stimulus in WT controls (black) and eaat2b−/− larvae (red). Corresponding FFT power plots for WT (B′) and eaat2b−/− (B″) were generated from the traces shown in (B). (C) Normalized power of flicker ERG responses at specified frequencies in WT controls and eaat2b−/− larvae. Power values were normalized to the 50 Hz line-noise peak. Statistical significance: p = 0.0039 at 5 Hz, p = 0.0007 at 8 Hz, p = 0.0031 at 10 Hz, p = 0.0133 at 15 Hz. Statistical analysis was performed using t-tests and nonparametric tests in GraphPad Prism, v. 8. Data are presented as mean ± s.e.m. Significance levels are indicated as follows: *p < 0.05; **p < 0.01; ***p < 0.001.
Acknowledgments
This image is the copyrighted work of the attributed author or publisher, and
ZFIN has permission only to display this image to its users.
Additional permissions should be obtained from the applicable author or publisher of the image.
Full text @ Open Biol.
Your Input Welcome
Thank you for submitting comments. Your input has been emailed to ZFIN curators who may contact you if
additional information is required.
Oops. Something went wrong. Please try again later.