
|
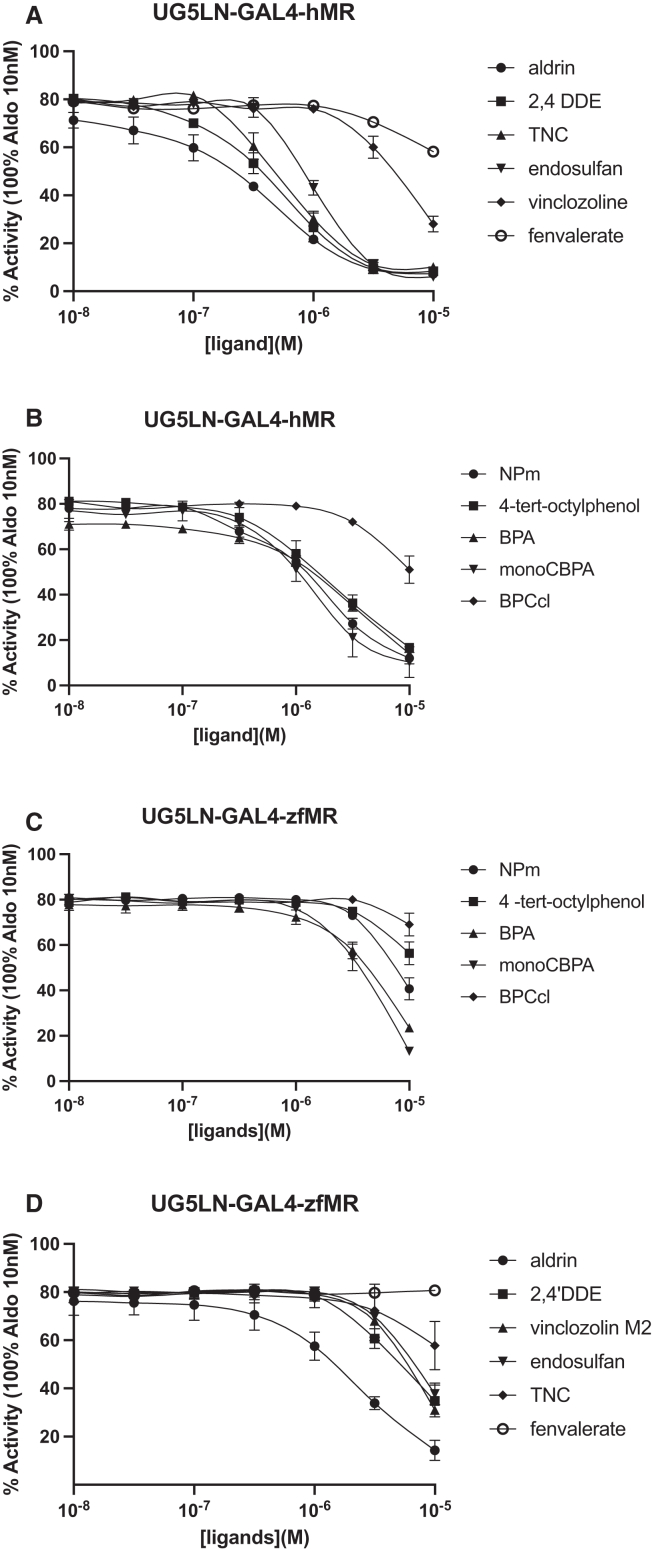
Figure 7
HMR and zfMR are targets of environmental chemicals
Dose-response curves of environmental chemicals in UG5LN-GAL4-hMR (A and B) and UG5LN-GAL4-zfMR (C and D) cells. Chemicals were tested in the presence of aldosterone 10−9 M in UG5LN-GAL4-hMR cells and 0.5 10−9 M in UG5LN-GAL4-zfMR cells (antagonism test). Results are expressed as the percentage of the maximum luciferase activity induced by 10−8 M aldosterone. The curves are presented as a non-linear regression; log (ligand) versus response. IC50 values (10−6 M) are shown in
Data are presented as means ± SD values. n (replicates per experiment) = 4 per group.