
IMAGE
Fig. 3
- ID
- ZDB-IMAGE-251110-3
- Publication
- Yu et al., 2025 - LPS disrupts erythroid-myeloid balance in zebrafish via Jak2/Stat3-Hif1a signaling
- All Figures
- Figures for Yu et al., 2025
Image
|
Figure Caption
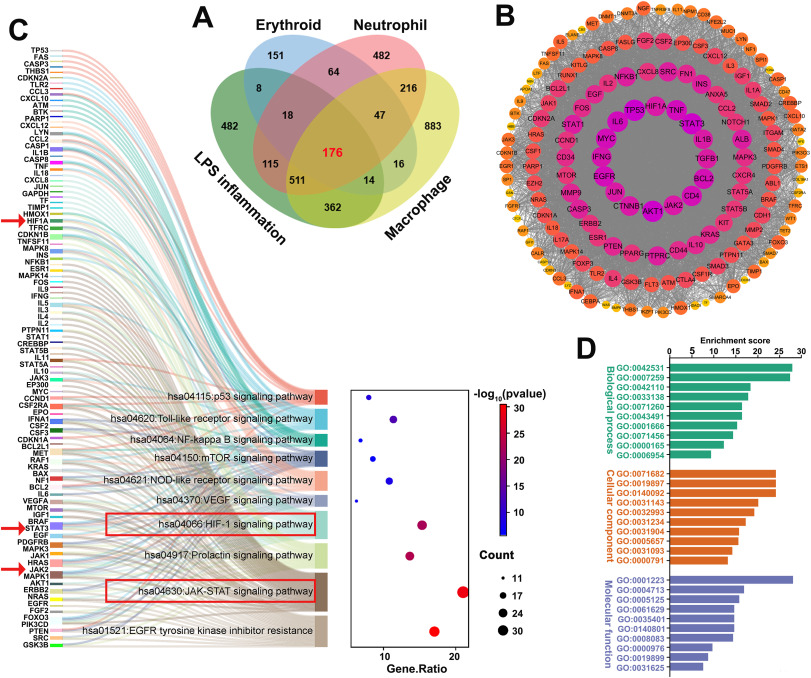
Fig. 3 Bioinformatics analysis of LPS-induced erythroid-myeloid hematopoietic differentiation Bias. (A) Venn diagram illustrating the intersection of targets related to LPS, erythroid, neutrophil, and macrophage lineages. (B) Protein-protein interaction (PPI) network of the 176 identified intersecting targets. (C) Enrichment and visualization of 87 genes associated with LPS-induced erythroid-myeloid differentiation bias using a Sankey-KEGG pathway bubble diagram. (D) Bar chart depicting the top 10 enriched GO enrichment analyses associated with LPS-induced erythroid-myeloid differentiation bias.
Figure Data
Acknowledgments
This image is the copyrighted work of the attributed author or publisher, and
ZFIN has permission only to display this image to its users.
Additional permissions should be obtained from the applicable author or publisher of the image.
Full text @ Fish Shellfish Immunol.