IMAGE

Figure 3.

ID
ZDB-IMAGE-251105-33
Source
Figures for Hall et al., 2025
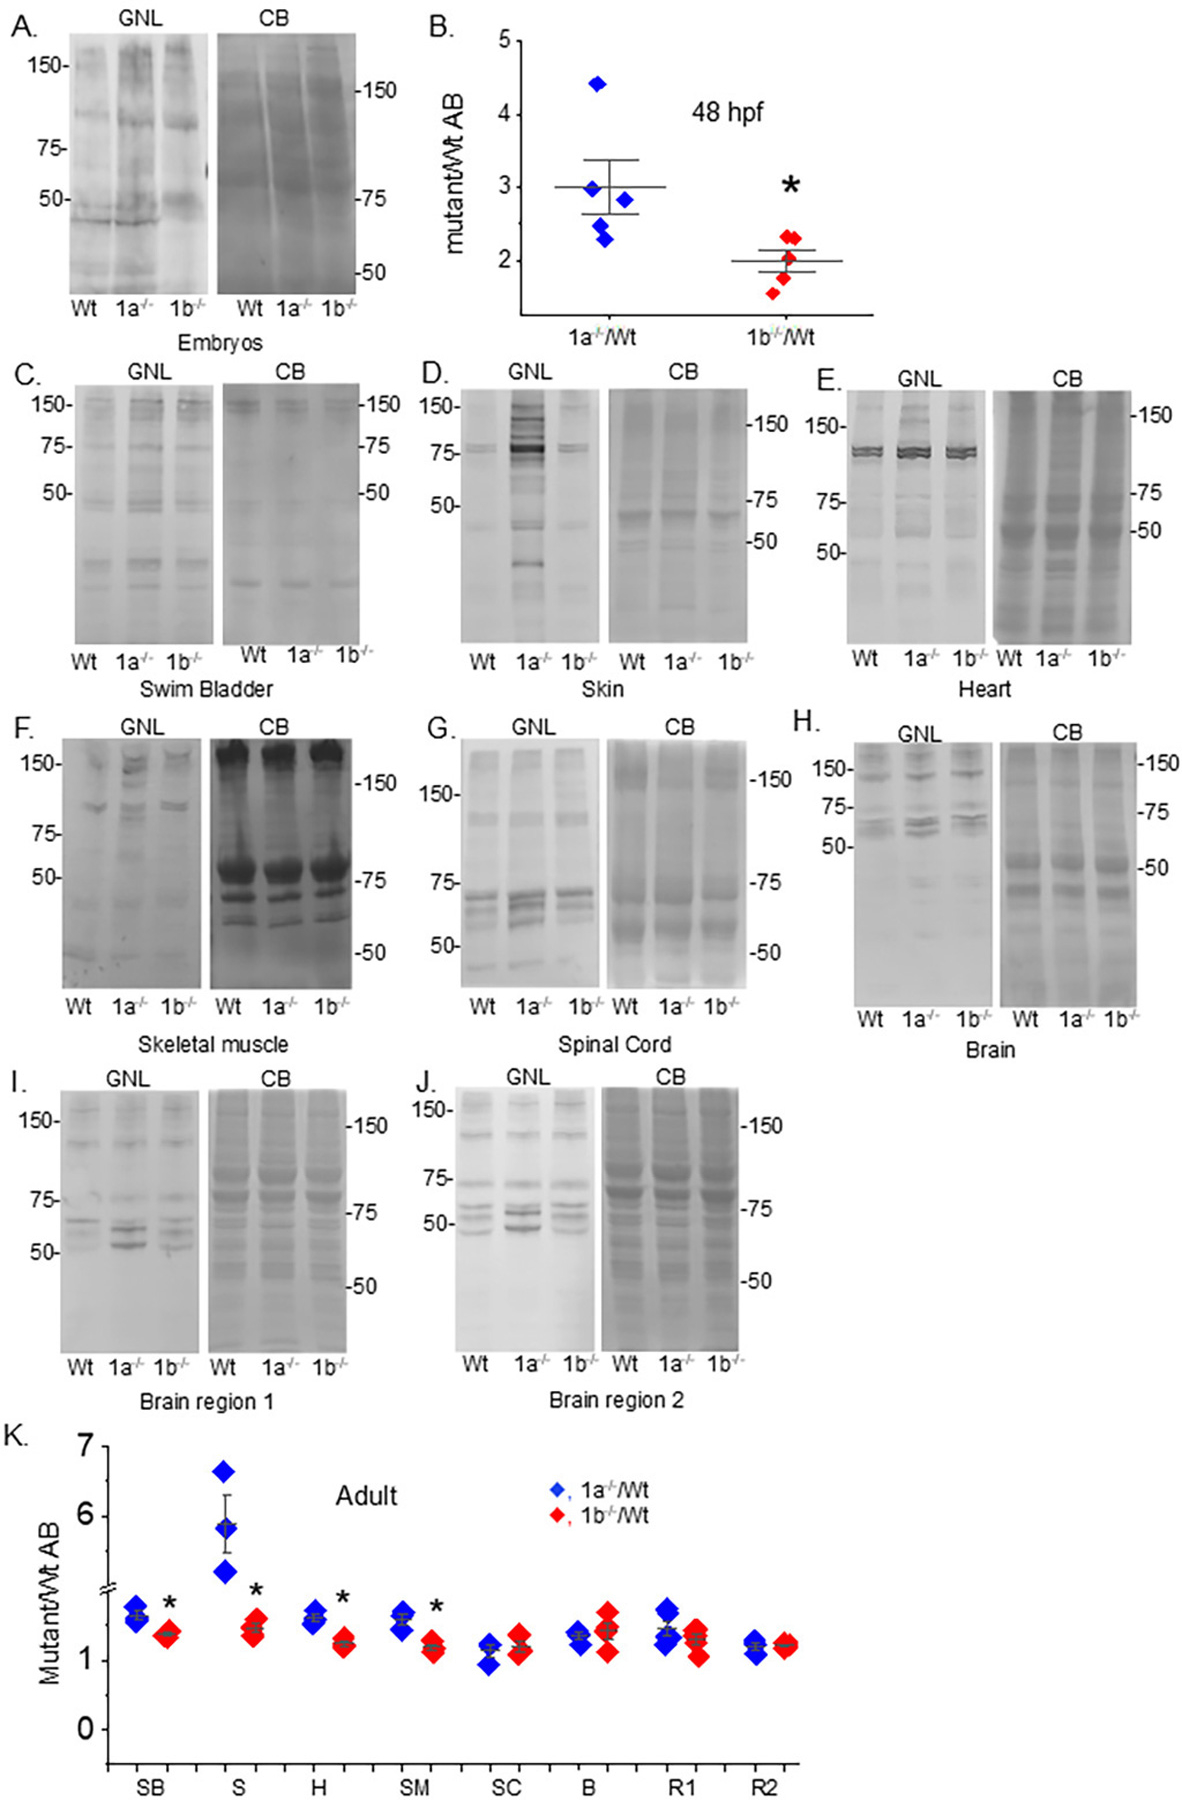
Image
Figure Caption

Figure 3.

Comparison of oligomannosylated protein in mutant and Wt AB fish strains. Lectin blot and Coomassie blue-stained gels of embryo (48 hpf) (A), and tissues from adult strains (CJ). Quantification of the oligomannosylated proteins from embryos (n = 5; Panel (B)), and adult tissues, including swim bladder (SB, n = 3), skin (S, n = 3), heart (H, n = 3), skeletal muscle (SM, n = 3), spinal cord (SC, n = 3), brain (B, n = 4), brain regions 1 (R1, n = 5) and 2 (R2, n = 3) (Panel (K)). Brain regions 1 includes olfactory bulb, telencephalon, habenula, and about half of optic tectum, while brain region 2 includes about half of the optic tectum, cerebellum, and medulla. Numbers adjacent to the blots signify protein markers (in kDa). Data were compared Student’s t-test (* p at 0.02).

Figure Data
Acknowledgments
This image is the copyrighted work of the attributed author or publisher, and ZFIN has permission only to display this image to its users. Additional permissions should be obtained from the applicable author or publisher of the image. Full text @ Int J Transl Med (Basel)