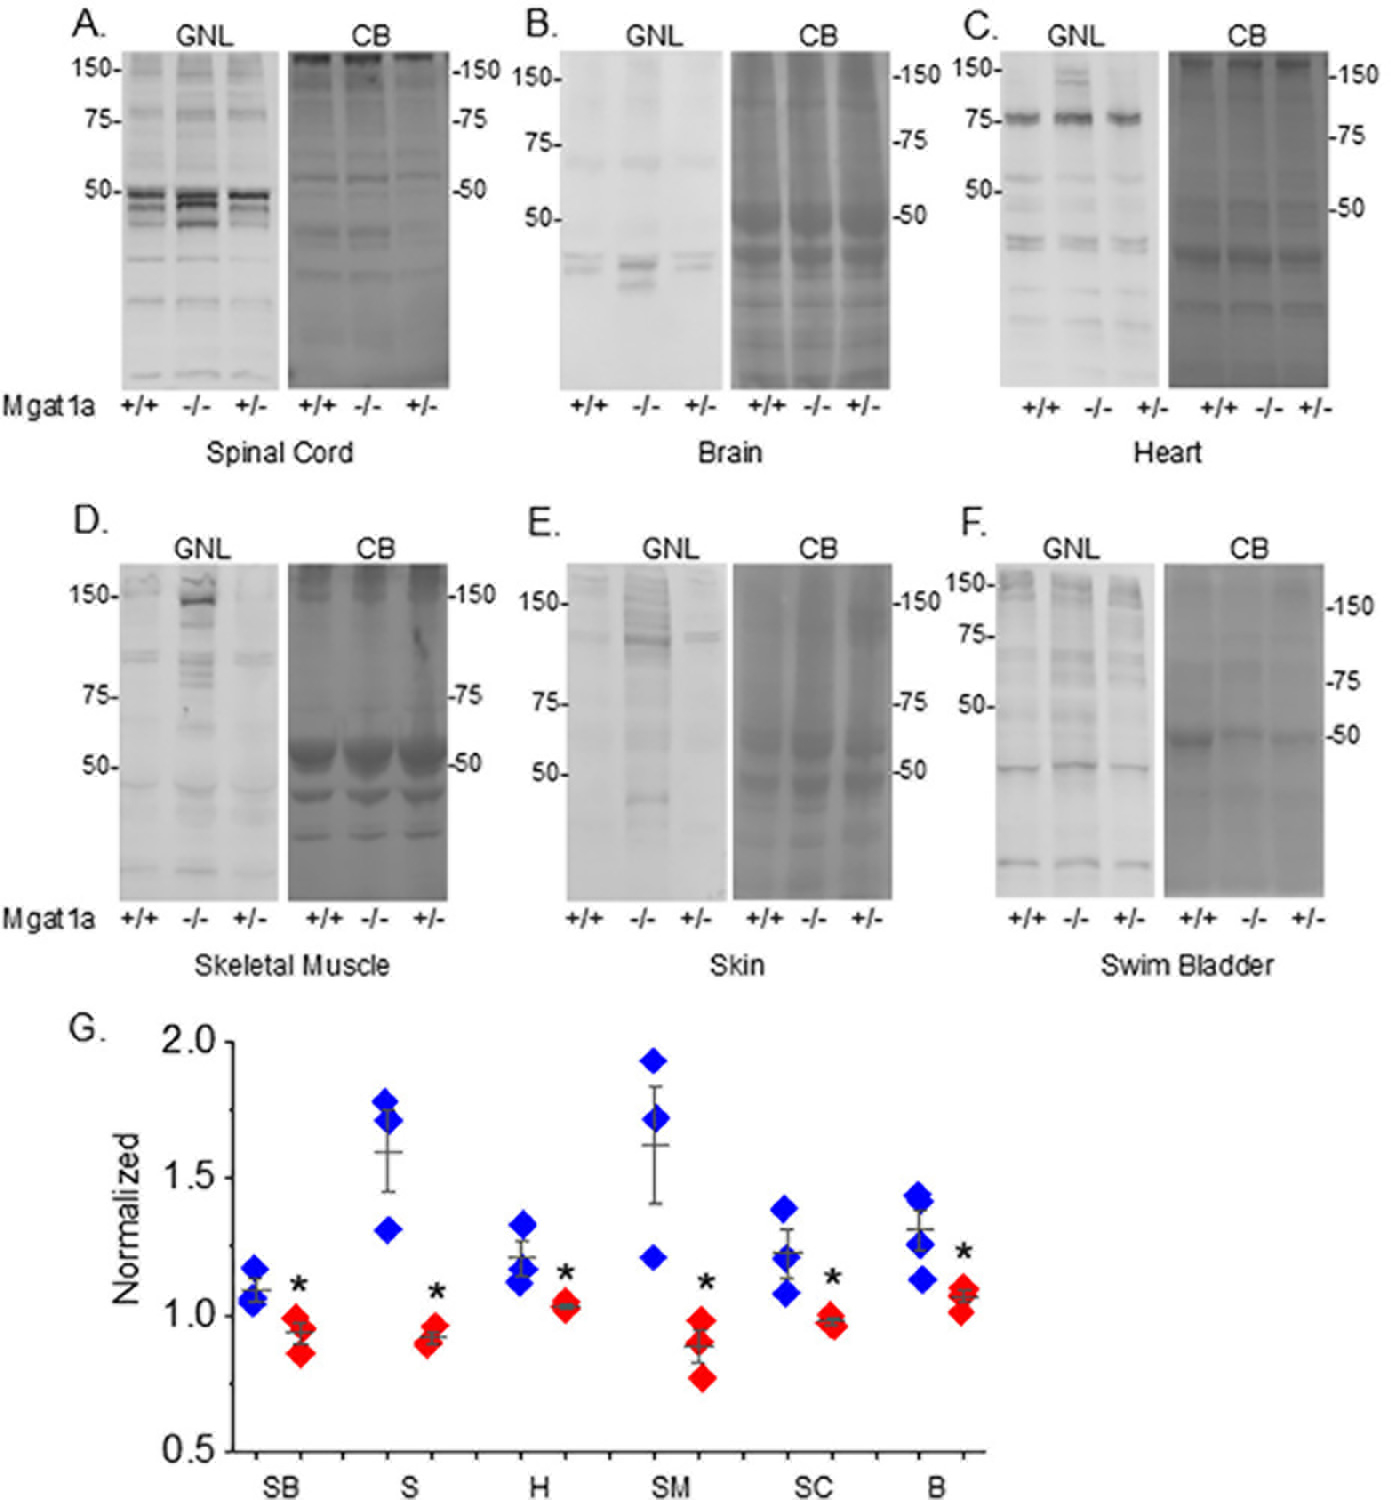
IMAGE

Figure 2.

ID
ZDB-IMAGE-251105-32
Source
Figures for Hall et al., 2025
Image
Figure Caption

Figure 2.

Increased levels of oligomannose-type N-glycans in adult mgat1a−/− zebrafish. Lectin blots of tissue homogenates from mgat1a+/+, mgat1a−/− and mgat1a+/− fish, as indicated (AF). Electrophoresed proteins were probed with GNL (left panels). Protein gels stained with Coomassie blue (CB) (right panels) to demonstrate equal protein loads among the samples. Quantification of the oligomannosylated proteins from swim bladder (SB, n = 3), skin (S, n = 3), heart (H, n = 3), skeletal muscle (SM, n = 3), spinal cord (SC, n = 3), and brain (B, n = 4) (G). Numbers adjacent to the blots denote protein markers (in kDa). Data is mean ± S.E. and compared via Student’s t-test (* p at 0.05).

Figure Data
Acknowledgments
This image is the copyrighted work of the attributed author or publisher, and ZFIN has permission only to display this image to its users. Additional permissions should be obtained from the applicable author or publisher of the image. Full text @ Int J Transl Med (Basel)