
Figure 5.
- ID
- ZDB-IMAGE-251023-23
- Publication
- Jamialahmadi et al., 2025 - Genome-wide interaction study with BMI identifies CYP7A1 and GIPR as genetic modulators of MASLD
- All Figures
- Figures for Jamialahmadi et al., 2025
|
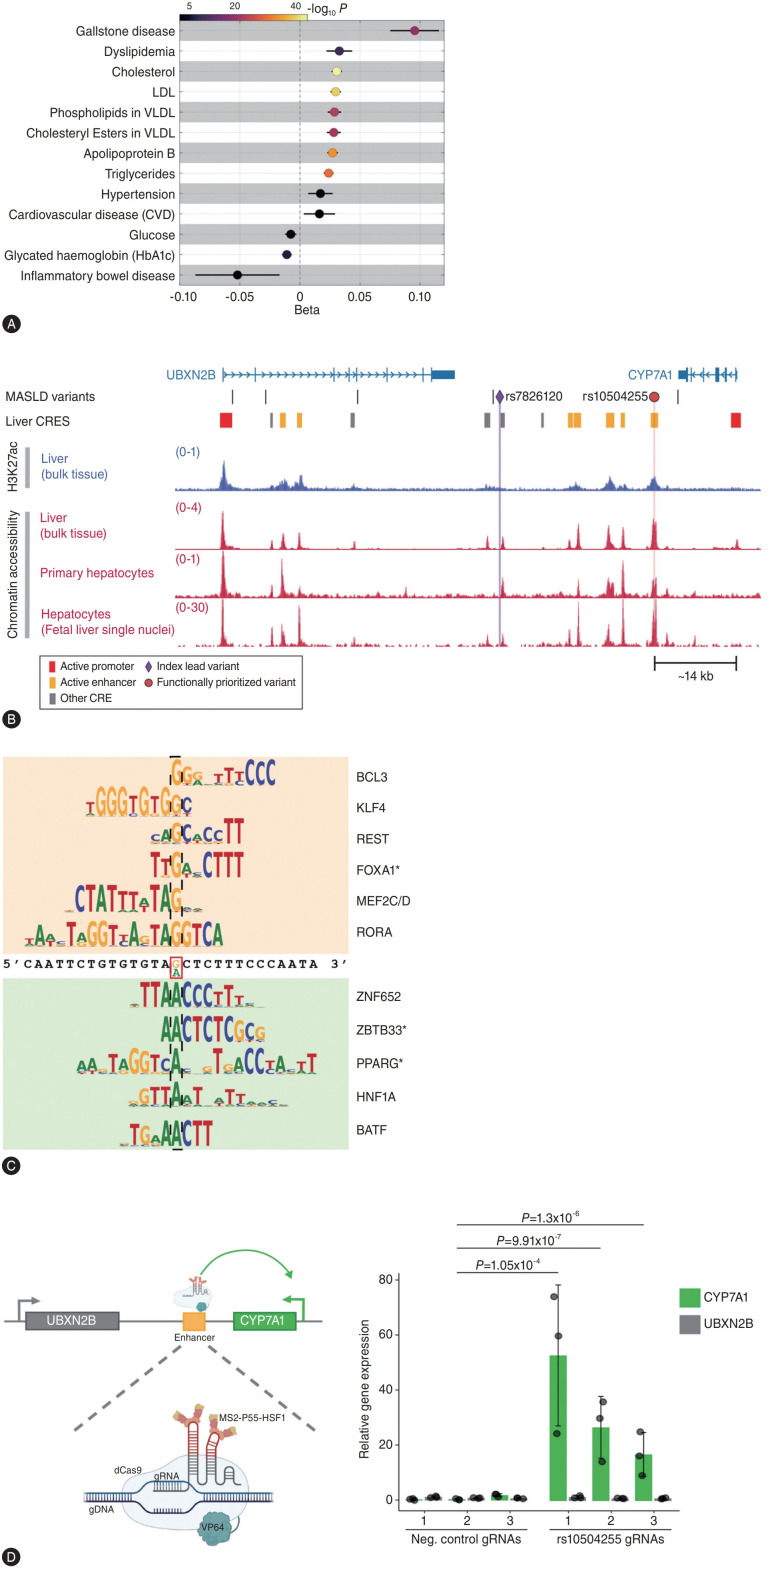
Figure 5.
The association of relevant traits with the rs7826120 T allele (UK Biobank). (A) Associations were examined by additive linear or logistic regression analyses adjusted for BMI, age, sex, age×sex, age2 and age2×sex, first 10 genomic principal components and array batch. For binary traits, log odds of effects are shown. The colour represents the –log10-transformed