
|
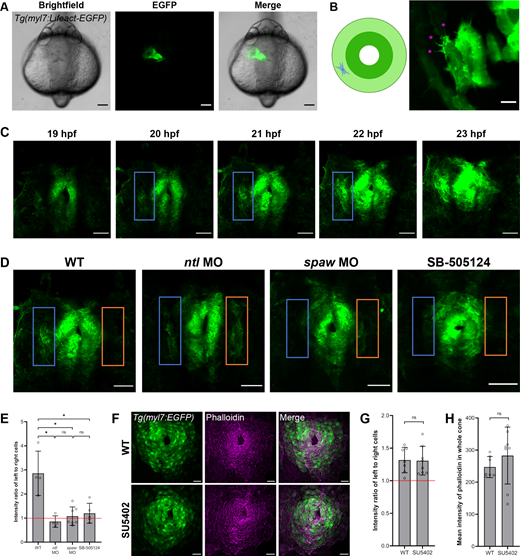
Fig. 4 F-actin dynamics are asymmetric and Nodal dependent in CPCs during jogging. (A) Tg(myl7:Lifeact-EGFP) embryo at 24 hpf demonstrating the fluorescence of the CPCs composing the heart tube. (B) Right: F-actin protrusions (pink asterisks) in a single CPC of a mosaic Tg(myl7:Lifeact-EGFP) embryo at 21 hpf. Left: Schematic showing the location of the CPC in the cardiac cone. (C) F-actin protrusive activity in left (blue box) compared to right CPCs in the cardiac cone of a WT Tg(myl7:Lifeact-EGFP) embryo throughout jogging from 19 to 23 hpf. (D) Cardiac cones of Tg(myl7:Lifeact-EGFP) WT, ntl morphant, spaw morphant, and SB505124-treated embryos, with left-sided (blue box) and right-sided (orange box) atrial CPCs outlined. (E) Fluorescence intensity ratio between left-sided and right-sided CPCs in the Tg(myl7:Lifeact-EGFP) embryos. WT, n=4; ntl MO, n=4; spaw MO, n=7; SB-505124, n=5. (F) Cardiac cones of Tg(myl7:EGFP) WT and SU5402-treated embryos stained with phalloidin. (G) Fluorescence intensity ratio between left-sided and right-sided CPCs in the phalloidin-stained embryos. WT, n=7; SU5402, n=8. (H) Fluorescence intensity measurements of the whole cardiac cone in the phalloidin-stained embryos. WT, n=7; SU5402, n=8. (A-D,F) Images are dorsal views, with anterior to the top and left to the reader's left. *P<0.01 (unpaired two-tailed Student's t-test). ns, not significant. Error bars represent s.d. Scale bars: 100 µm (A); 2.5 µm (B); 50 µm (C,D); 25 µm (F).