
|
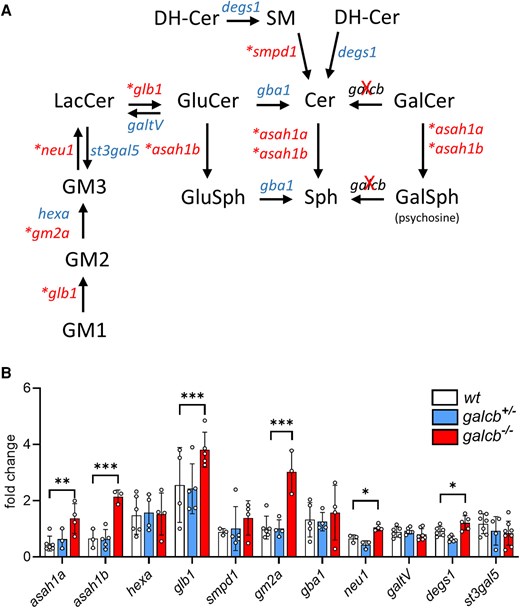
Fig. 6 Expression of enzymes involved in LacCer/cer metabolism in the brain of galcb knockout zebrafish. (A) Schematic representation of major metabolic pathways involved in LacCer/Cer metabolism. (B) The expression of the indicated genes has been assessed by RT-qPCR in the brain of wild-type (WT) and galcb knockout (KO) mutants at 4 months post fertilization. For each gene, the data were normalized to its expression in one WT animal. Data are the mean ± standard deviation of 4–6 animals per group. One-way ANOVA (Tukey's multiple comparison test): *P < 0.05, **P < 0.01, ***P < 0.001. In A, enzymes exhibiting upregulated gene expression in brains of galcb KO animals are marked by asterisks. LacCer = lactosylceramide; RT-qPCR = reverse transcriptase-quantitative PCR.