
|
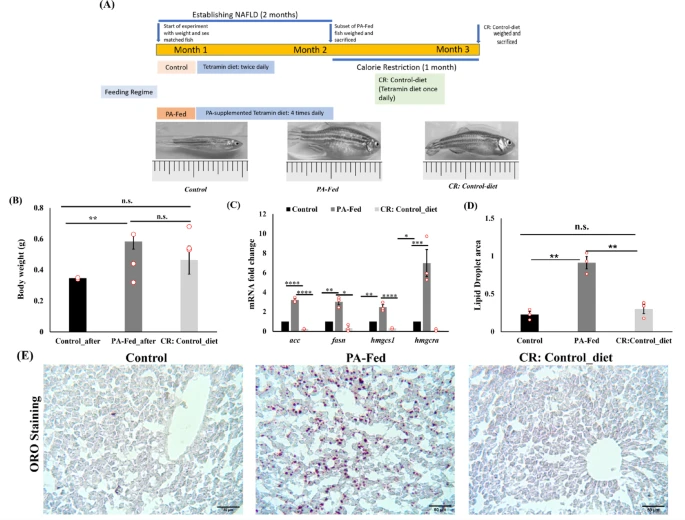
Fig. 4 Calorie restriction improves body weight, lipid accumulation and expression of lipid metabolism related genes. (A) Schematic representation of the calorie restriction paradigm. (B) Body weight analysis of control, PA-fed and calorie restriction groups (n = 3). (C) Calorie restriction affects hepatic expression of genes associated with lipid metabolism (n = 3). Values are given as mean ± SEM. Student’s t test was performed to determine statistical significance. *p < 0.05, **p < 0.01, ***p < 0.001, ****p < 0.0001, n.s., not statistically significant. Calorie restriction reverses hepatic lipid accumulation: (D) quantification of Oil Red O staining in control, PA-fed and CR group shows decrease in lipid droplet area upon calorie restriction. (E) Decreased lipid droplet overload shown by Oil Red O staining of 8 μm thick liver cryosections of control, PA-Fed and CR groups (40 × magnification, images captured using DEBRO DIM 150, inverted microscope). Scale bar 50 μm. CR: Control_diet, calorie restriction group given control diet.