
|
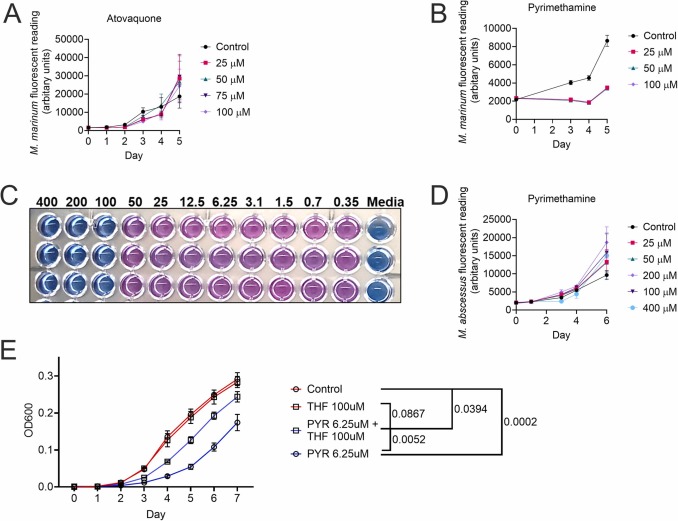
Fig. 4 Direct antibiotic effect of pyrimethamine against M. marinum and M. tuberculosis, but not M. abscessus, cultures in vitro. (A) Growth curve of M. marinum treated with atovaquone as indicated. (B) Growth curve of M. marinum treated with pyrimethamine as indicated. (C) Minimum inhibitory concentration determination of M. tuberculosis treated with pyrimethamine at concentrates indicated in μM. (D) Growth curve of M. abscessus treated with pyrimethamine as indicated. (E) Growth curve of M. marinum treated with 6.25 μM pyrimethamine (PYR) and 100 μM tetrahydrofolic acid (THF). Statistical comparisons are of technical replicates of Day 7 OD600 readings by ANOVA.