
Image
|
Figure Caption
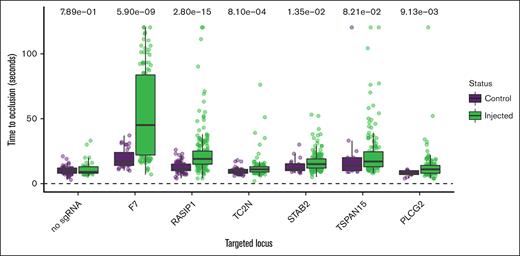
Fig. 3 Functional evidence for causal genes in genetically modified zebrafish.P values from Wilcoxon rank sum tests are listed at the top. The y-axis represents the experimental TTO for control and sgRNA-injected zebrafish embryos with the x-axis showing the genes targeted through CRISPR. Injections made without sgRNA served as a negative control. Factor 7 (F7) served as a positive control.
Acknowledgments
This image is the copyrighted work of the attributed author or publisher, and
ZFIN has permission only to display this image to its users.
Additional permissions should be obtained from the applicable author or publisher of the image.
Full text @ Blood Adv