IMAGE

Figure 7

ID
ZDB-IMAGE-251004-92
Source
Figures for Stemerdink et al., 2025
Image
Figure Caption

Figure 7

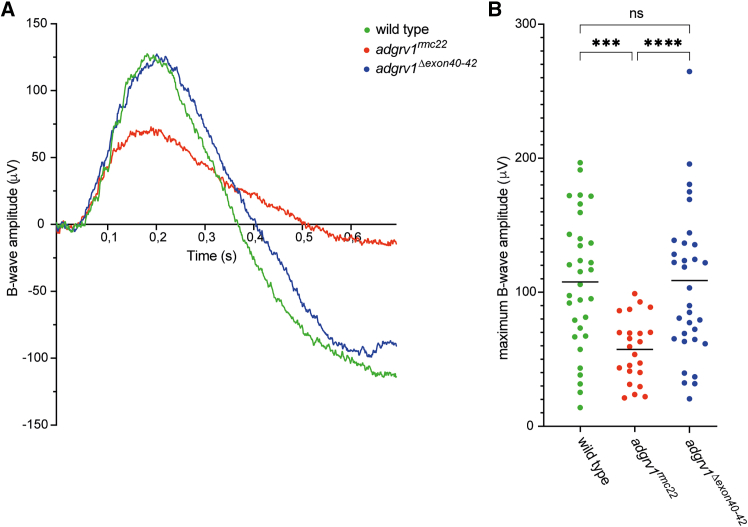
ERG recordings reveal normal retinal function in adgrv1Δexon40-42 zebrafish

(A) Representative ERG traces of wild-type, adgrv1rmc22, and adgrv1Δexon40-42 zebrafish larvae (7 dpf). (B) Maximum B-wave amplitudes following a light stimulus of 1,000 lux. The mean maximum B-wave amplitude of adgrv1Δexon40-42 larvae is similar to those observed in wild types, whereas adgrv1rmc22 larvae show a significant decrease in maximum B-wave amplitudes (∗∗∗p = 0.0001; ∗∗∗∗p < 0.0001; one-way ANOVA followed by Tukey’s multiple comparison test).

Acknowledgments
This image is the copyrighted work of the attributed author or publisher, and ZFIN has permission only to display this image to its users. Additional permissions should be obtained from the applicable author or publisher of the image. Full text @ Mol Ther Nucleic Acids