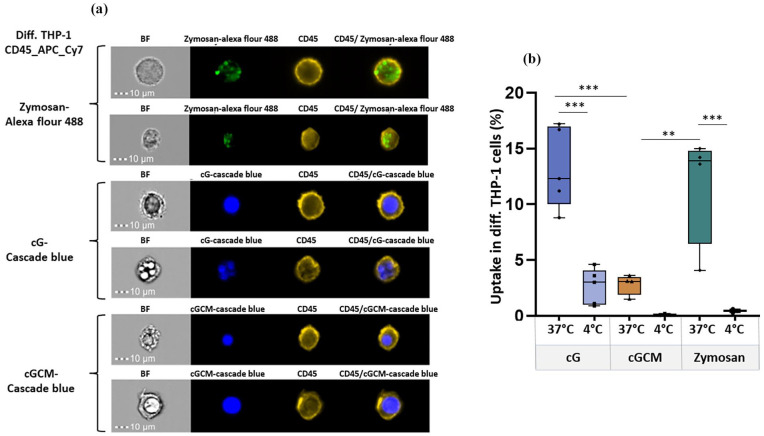
IMAGE

Figure 4.

ID
ZDB-IMAGE-251004-12
Source
Figures for Chugh et al., 2025
Image
Figure Caption

Figure 4.

In vitro cellular uptake studies of zymosan A (S. cerevisiae) bioparticles™, gelatin microspheres (cG), and NK cell mimics (cGCM) by differentiated (diff.) THP-1 cells as macrophages for 3 h using Image Stream X (cell/particle: 1:1): (a) For each condition (zymosan, cG–Cascade Blue, and cGCM–Cascade Blue), two representative single-cell uptake images are shown. Each pair includes a brightfield (BF) and the corresponding fluorescence image captured from the same field of view, highlighting the internalization and localization of particles within individual cells at 37°C and (b) comparative analysis of the uptake at 4°C and 37°C (cG vs cGCM, p = 0.0004, 95% CI = 4.397 to 16.45; cGCM vs Zymosan (p = 0.0035, 95% CI = −15.26 to −2.556), N = 3–5. Zymosan A was used as a positive control and uptake analysis at 4°C was used as a negative control. Zymosan A (S. cerevisiae) bioparticles™ was tagged with Alexa Flour™ 488, cG and cGCM was loaded with dextran cascade blue, diff. THP-1 cells was tagged with CD45_APC_Cy7 dye.

Graphs are plotted in box and whiskers format with max and min value showing all data points.

*p < 0.05. **p < 0.01. ***p < 0.001. ****p < 0.0001.

Acknowledgments
This image is the copyrighted work of the attributed author or publisher, and ZFIN has permission only to display this image to its users. Additional permissions should be obtained from the applicable author or publisher of the image. Full text @ J Tissue Eng