
Image
|
Figure Caption
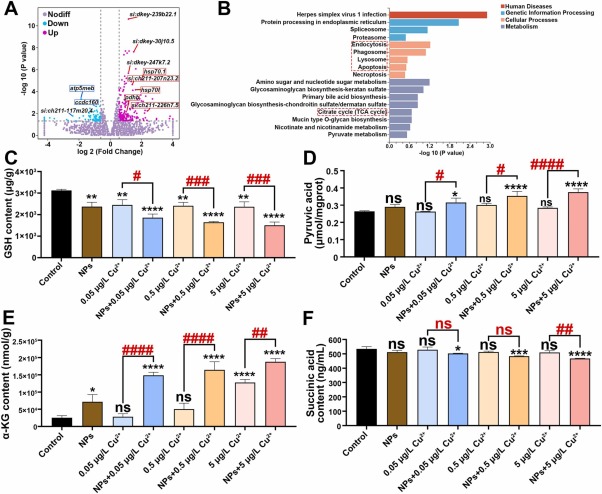
Fig. 5 Analysis of DEGs volcano map, KEGG enrichment map and TCA cycle key indicators were detected. Differentially expressed genes volcano map (A), and KEGG pathway enrichment analysis map of differentially expressed genes was made. (B). Pyruvate content (C), α-KG content (D), succinic acid content (E), GSH content (F) was detected in different treatment groups (*/#P < 0.05, **/##P < 0.01, ***/###P < 0.001 and ****/####P < 0.0001).
Acknowledgments
This image is the copyrighted work of the attributed author or publisher, and
ZFIN has permission only to display this image to its users.
Additional permissions should be obtained from the applicable author or publisher of the image.
Full text @ Ecotoxicol. Environ. Saf.