
|
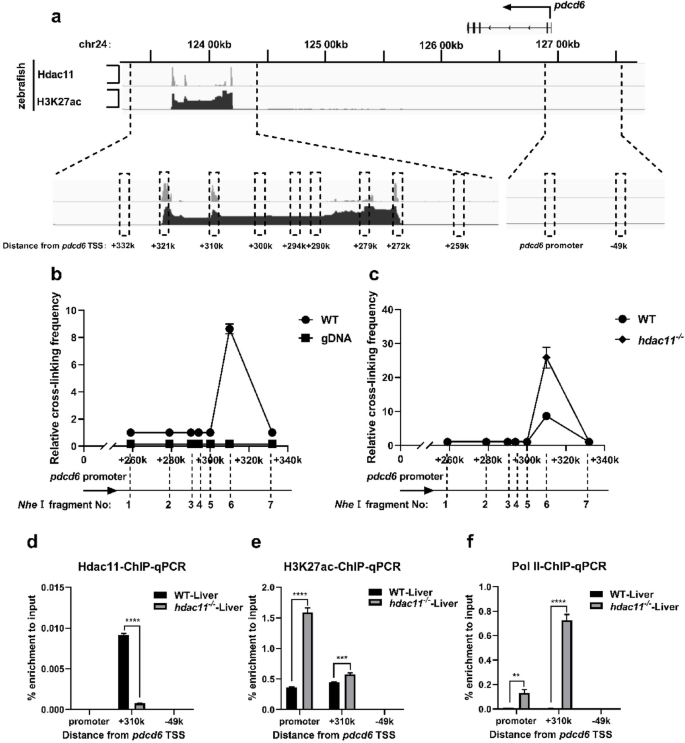
Fig. 2 The knockout of hdac11 promotes interaction between pdcd6 + 310k region and pdcd6 promoter. (a) ChIP-seq data showed the enrichment of Hdac11 and H3K27ac at the pdcd6 locus. (b, c) 3 C-qPCR showed interaction frequency between indicated pdcd6 downstream regions and pdcd6 promoter in WT and hdac11−/− zebrafish liver. The Nhe Ⅰ fragment numbers represented different restriction sites, 1: +259k, 2: +279k, 3: +290k, 4: +294k, 5: +300k, 6: +310k, 7: +332k. (d, e, f) ChIP-qPCR showed the enrichment of Hdac11 (d), H3K27ac (e) and Pol Ⅱ (f) at indicated regions in zebrafish liver. Data are represented as mean ± SD of three independent experiments, and P values are calculated using Student’s t-test (**P < 0.01; ***P < 0.001; ****P < 0.0001)