IMAGE

Fig. 2

ID
ZDB-IMAGE-250906-48
Source
Figures for Shang et al., 2025
Image
Figure Caption

Fig. 2

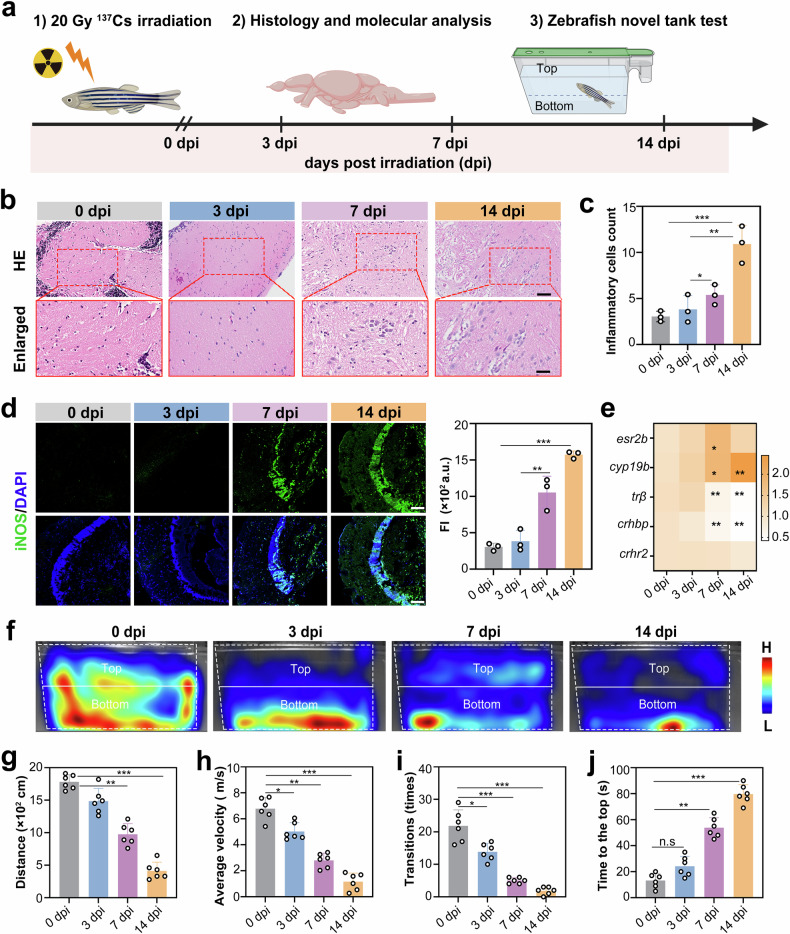
Radiation-induced neuropathology in adult zebrafish brains. a Experimental timeline for whole-body irradiation with 20 Gy γ-rays (0.84 Gy/min, 24 min) followed by subsequent analyses. Examinations were conducted at 3, 7, and 14 dpi. These included brain histology, molecular assays, and behavioral tests using novel tank locomotor analysis. b Representative HE-stained images of adult zebrafish brains. The boxed areas show enlarged views of the optic tectum. c Quantification of inflammatory infiltrates in the brain parenchyma (n = 3 brains per group; one-way ANOVA). d Representative images of iNOS immunofluorescence and quantification of fluorescence intensity (n = 3 brain sections; one-way ANOVA). e Heatmap of neuroendocrine-related gene mRNA expression (esr2b, cyp19b, trβ, crhbp, crhr2) across time points. f–j Novel tank behavioral profiling: heatmaps depicting spatial distribution (top/bottom zones demarcated by the horizontal midline) (f); total distance (g); average velocity (h); number of transitions (i); latency to enter the top (j) (fj: n = 6 zebrafish; one-way ANOVA). All the statistical data are presented as the means ± SEMs. Scale bars: 200 μm (b, top), 50 μm (b, boxed areas), 100 μm (d)

Acknowledgments
This image is the copyrighted work of the attributed author or publisher, and ZFIN has permission only to display this image to its users. Additional permissions should be obtained from the applicable author or publisher of the image. Full text @ Signal Transduct Target Ther