
|
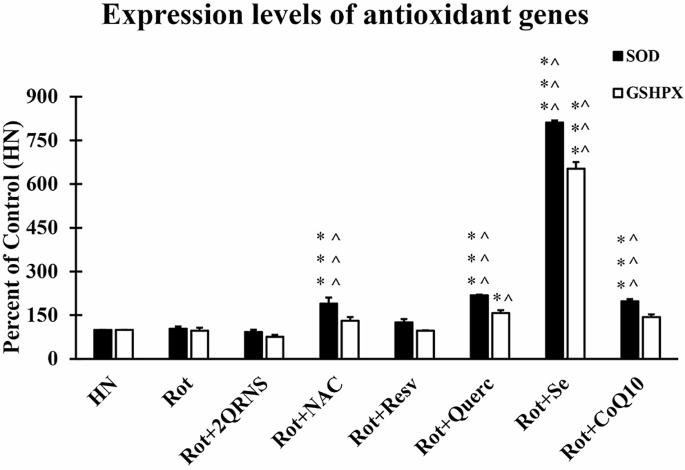
Fig. 3 Expression levels of antioxidant genes in experimental groups. The expression levels of genes were normalized to the GAPDH gene and the data are presented as a percentage of the control group (healthy group). Comparison of groups was performed using the ANOVA test. P > 0.05 was considered as a significant level. *P > 0.05, **P > 0.01, ***P > 0.001 indicate a significant difference with the healthy group. ^P > 0.05, ^^P > 0.01, ^^^P > 0.001 indicate a significant difference with the rotenone group. Abbreviations: HN (healthy group) Rot (rotenone), 2QRNS (drug cocktail consisting of N-acetylcysteine, resveratrol, quercetin, selenium and coenzyme Q10), NAC (N-acetylcysteine), Resv (resveratrol), Querc (quercetin), Se (selenium), CoQ10 (coenzyme Q10)